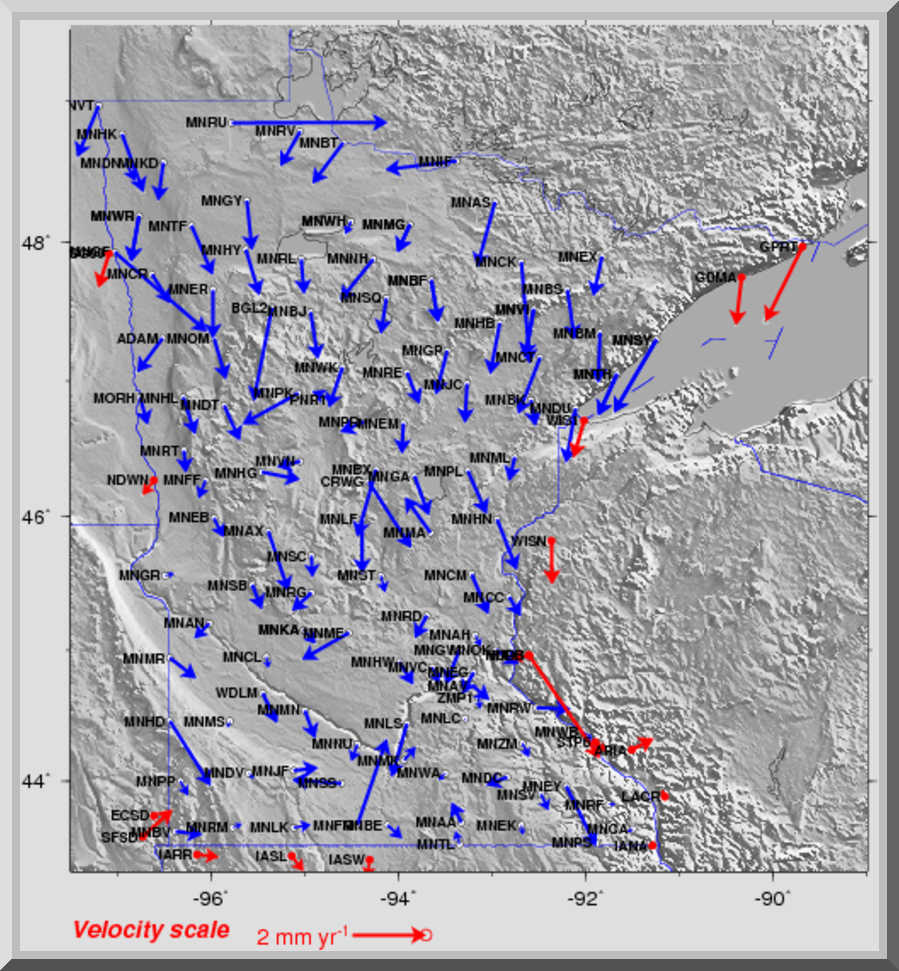
Map information: The map at the right shows the motions of the Minnesota and
other regional GPS stations with respect to the interior of the North America tectonic plate.
Red arrows are Minnesota sites; blue arrows are for sites operated other agencies.
Some time series are too short to give reliable estimates of the station motions given the
inherent noise in the GPS data. Minnesota is in the plate interior and thus moves slowly or not
at all relative to it. Therefore, over time, these arrows will become shorter.
Also see the U.S. GPS velocity map (link at the left).
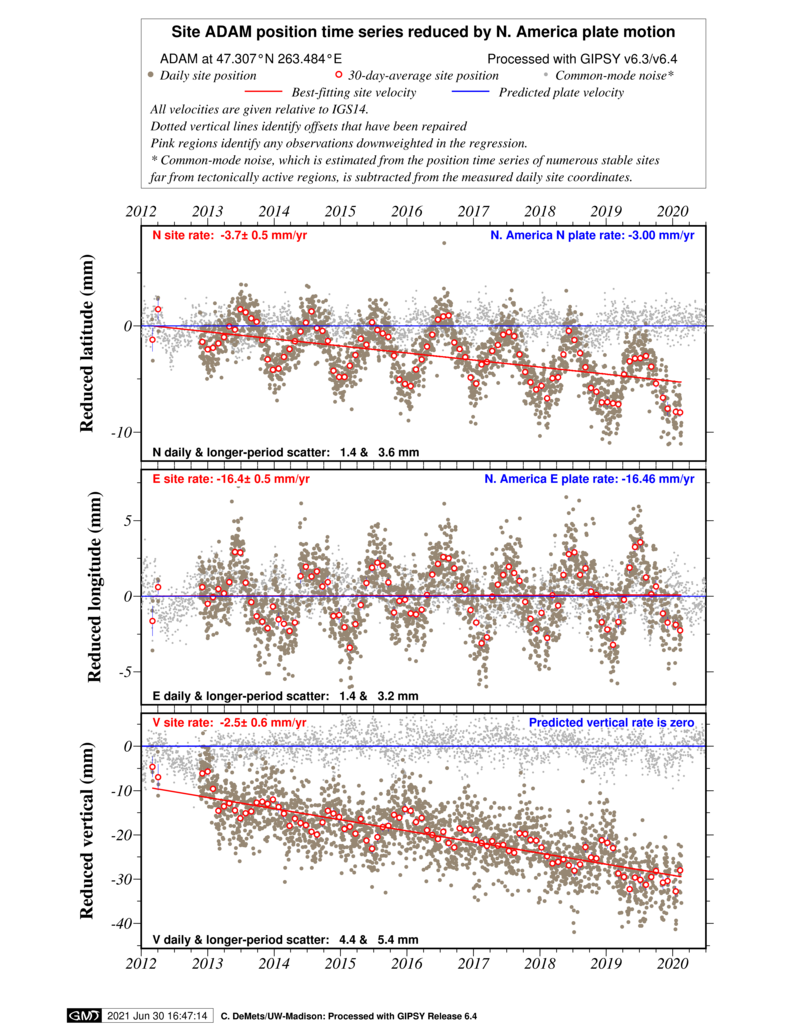
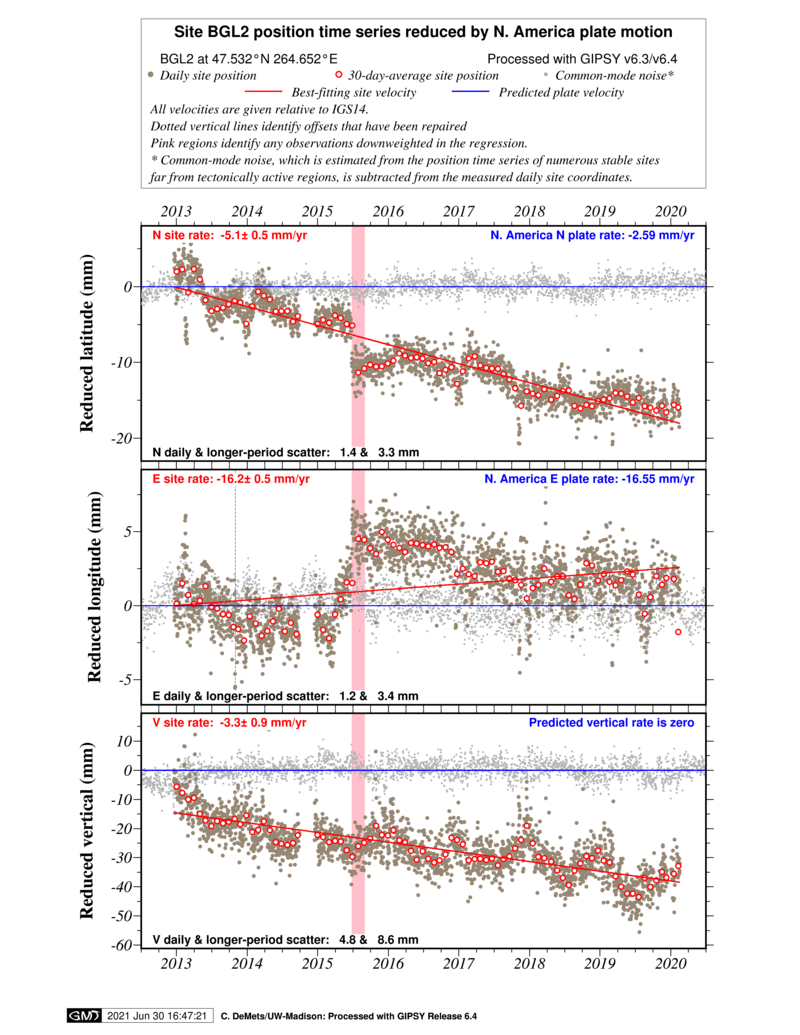
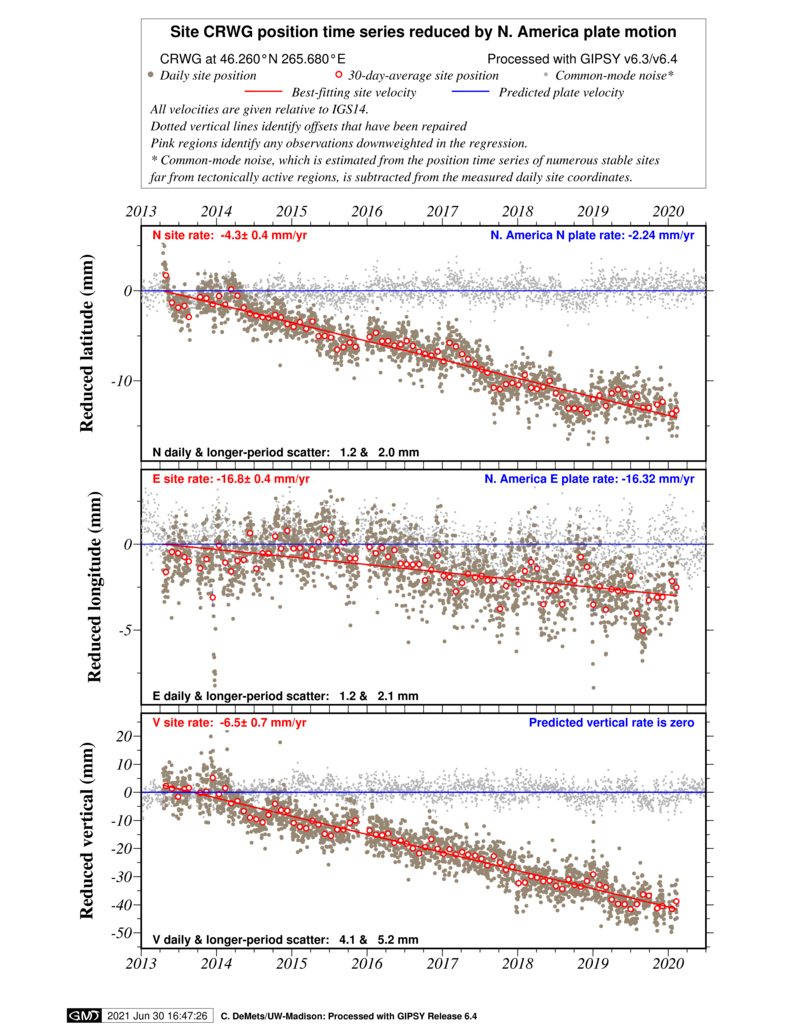
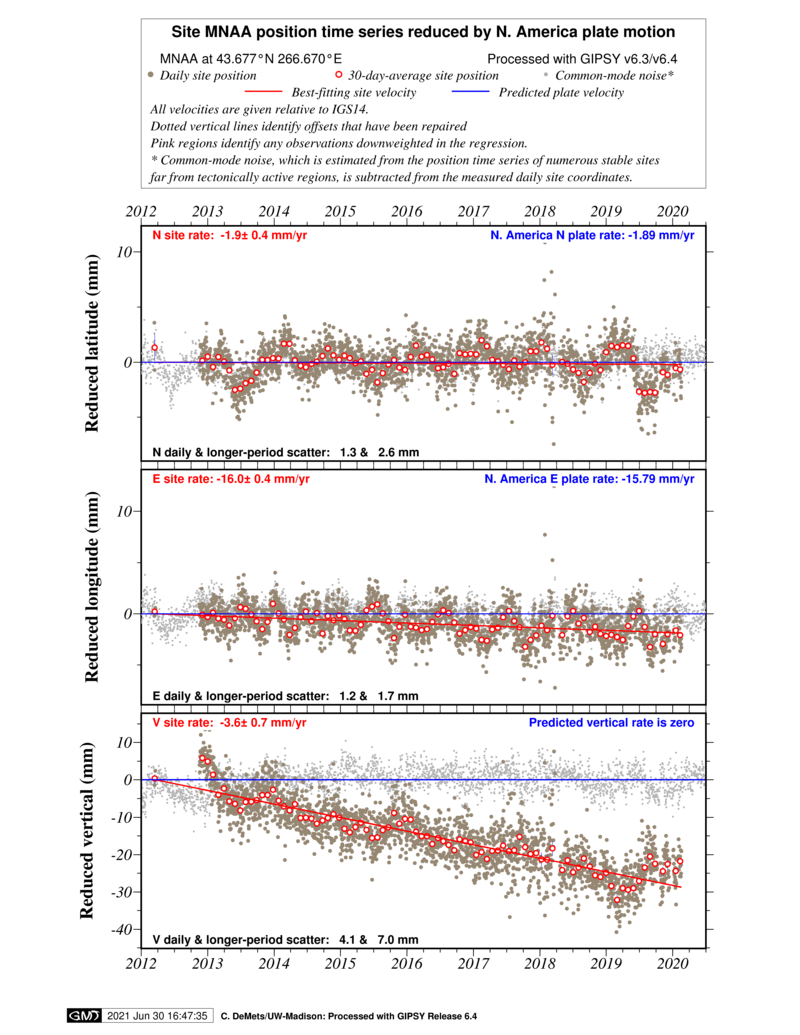
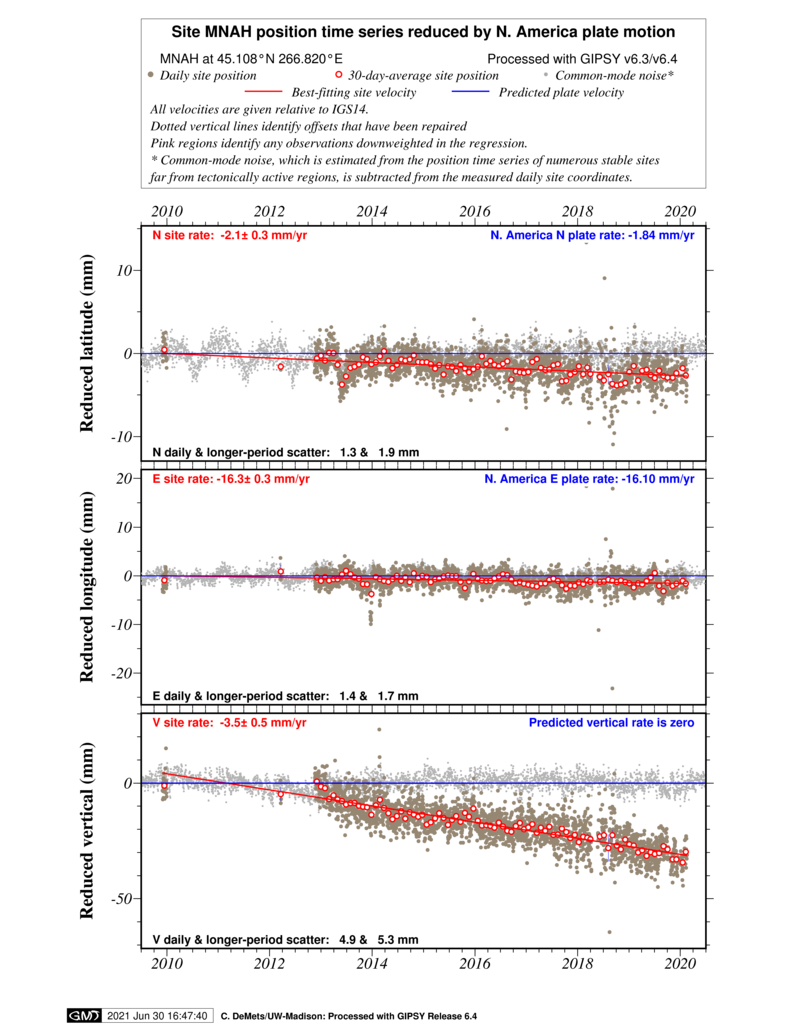
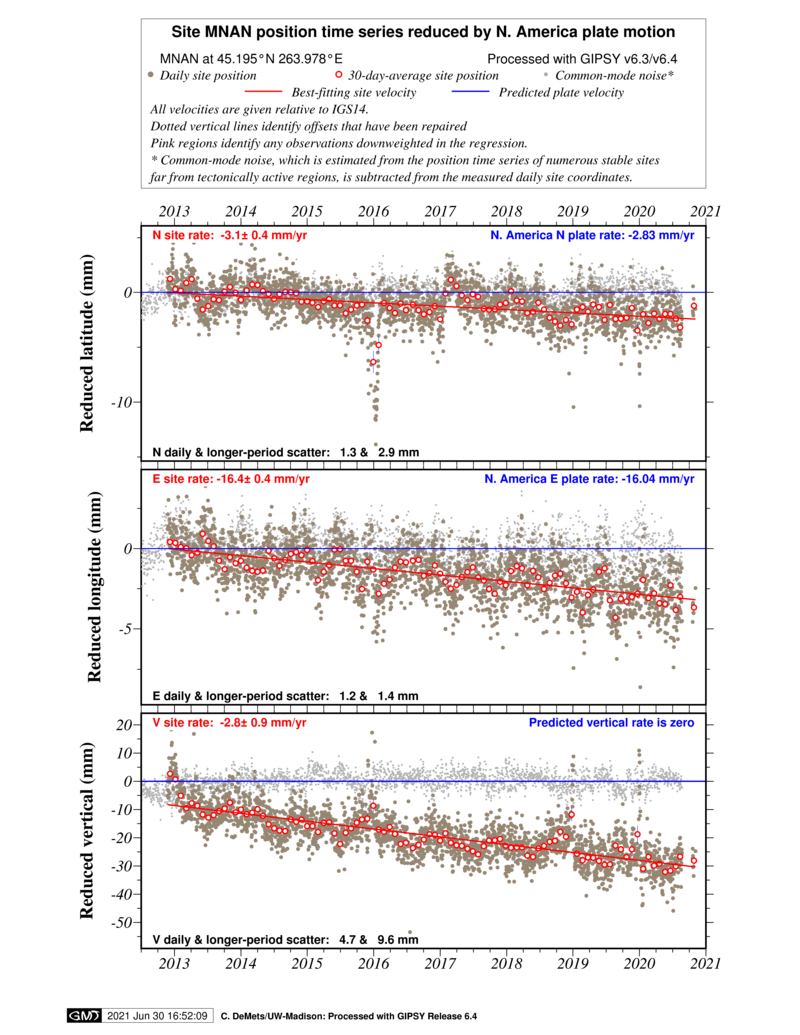
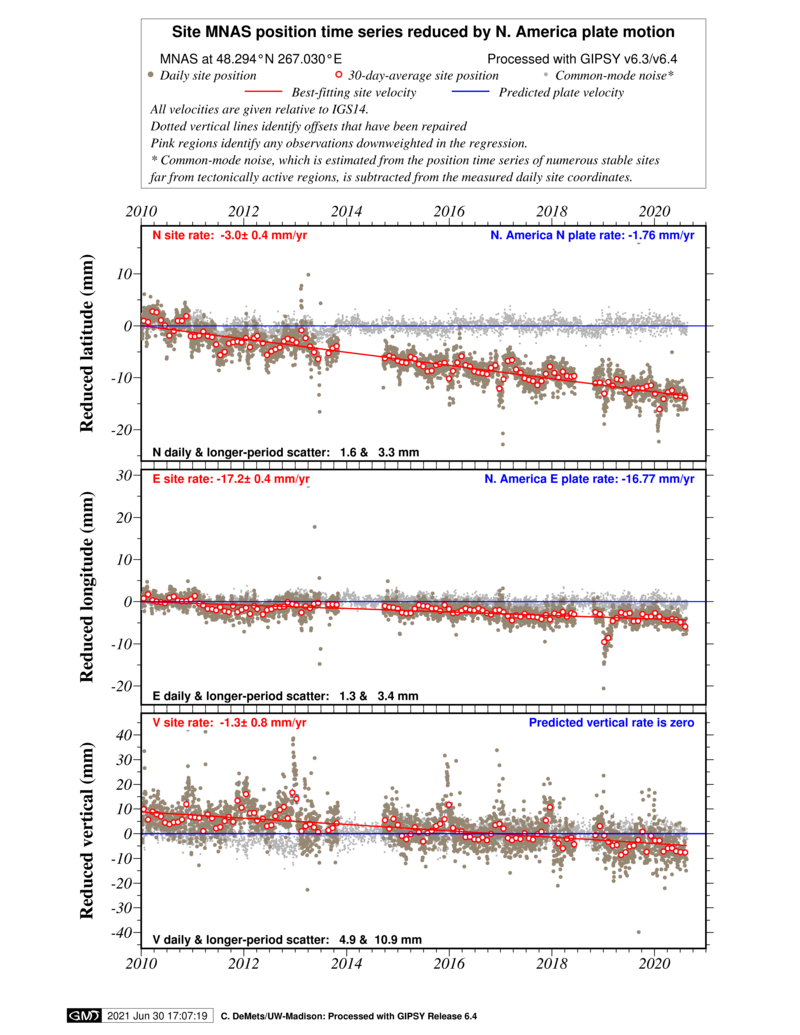
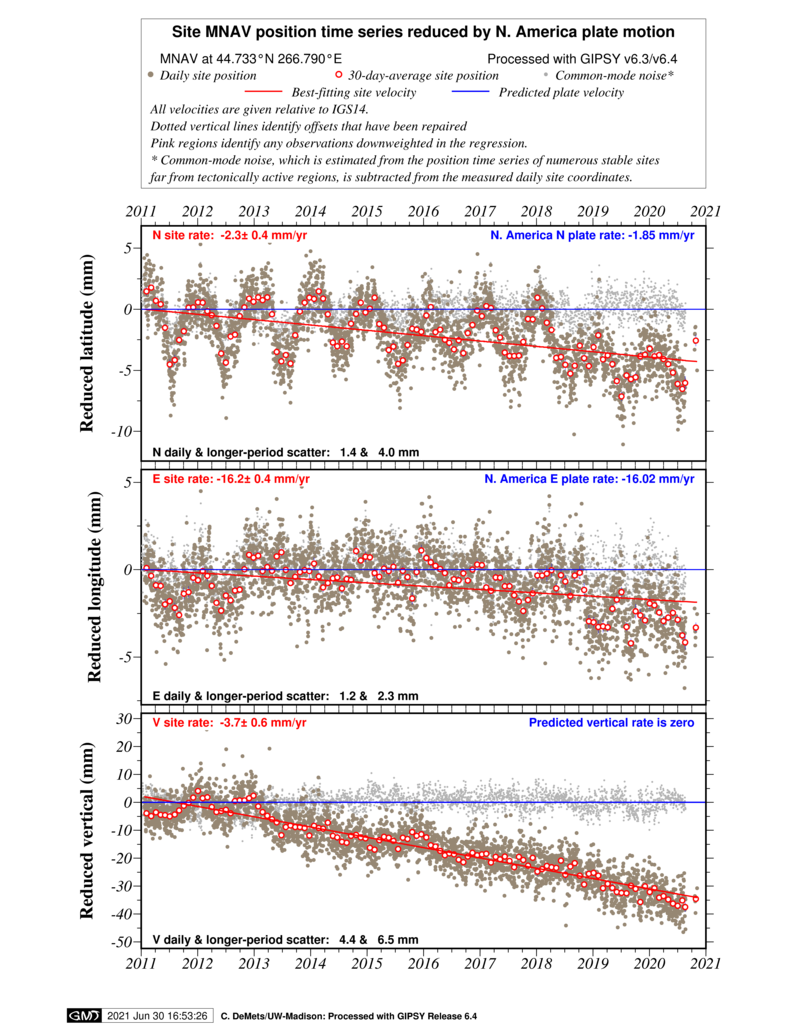
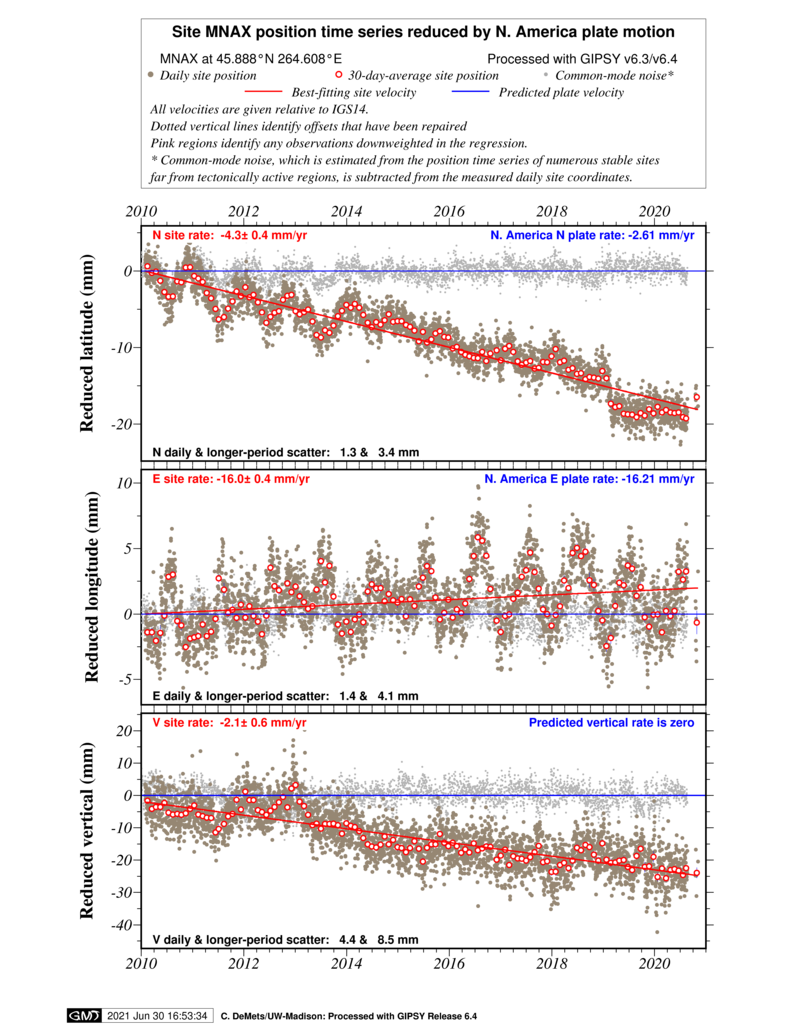
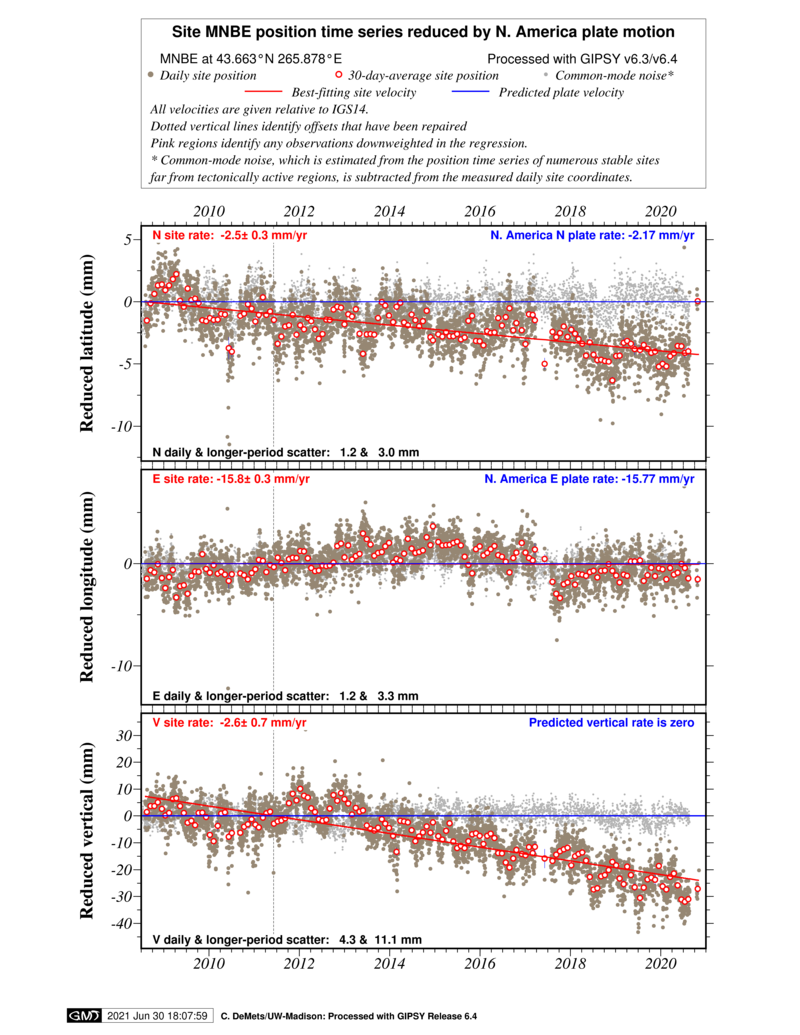
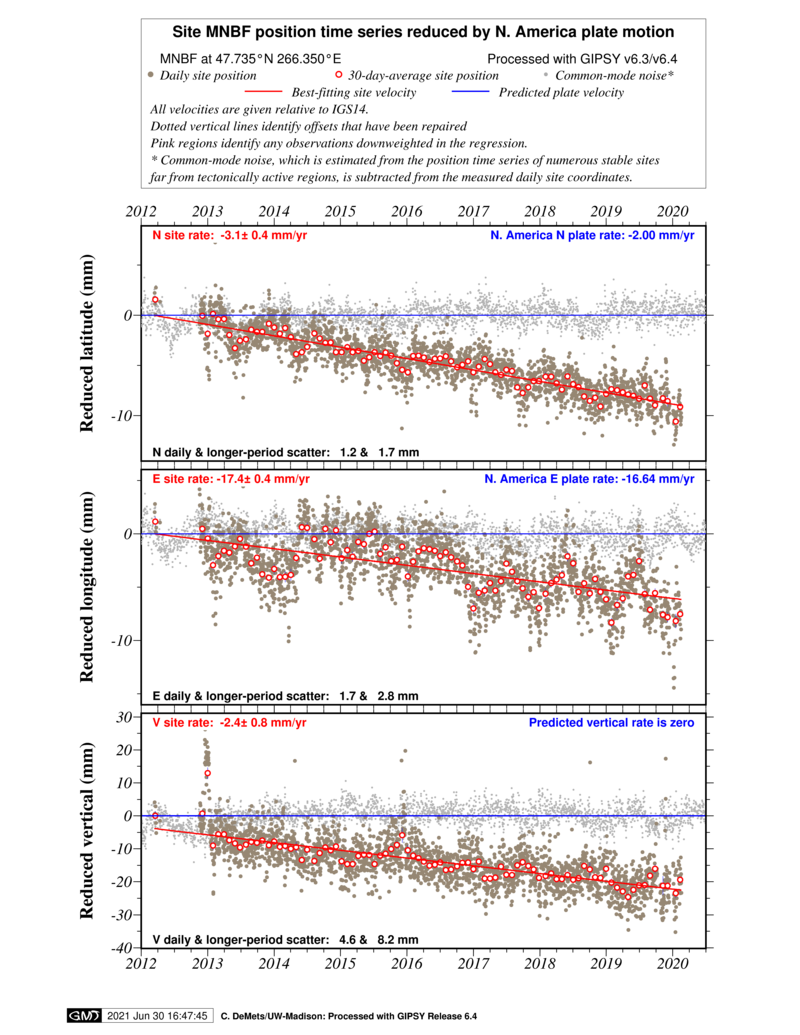
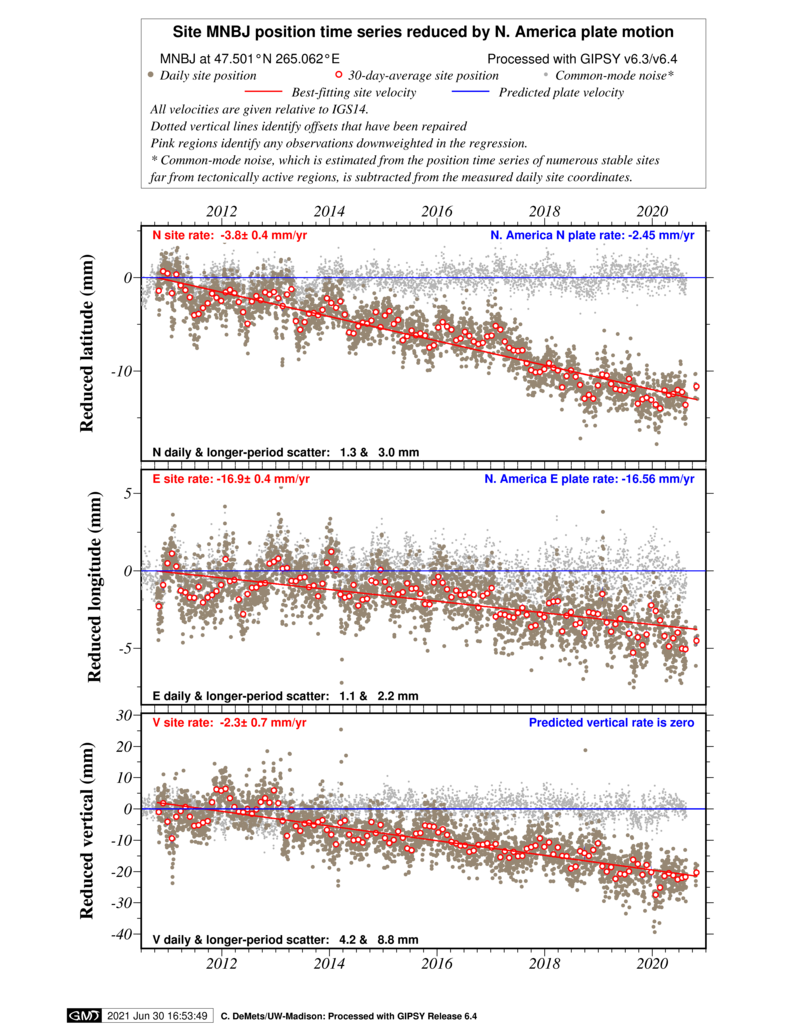
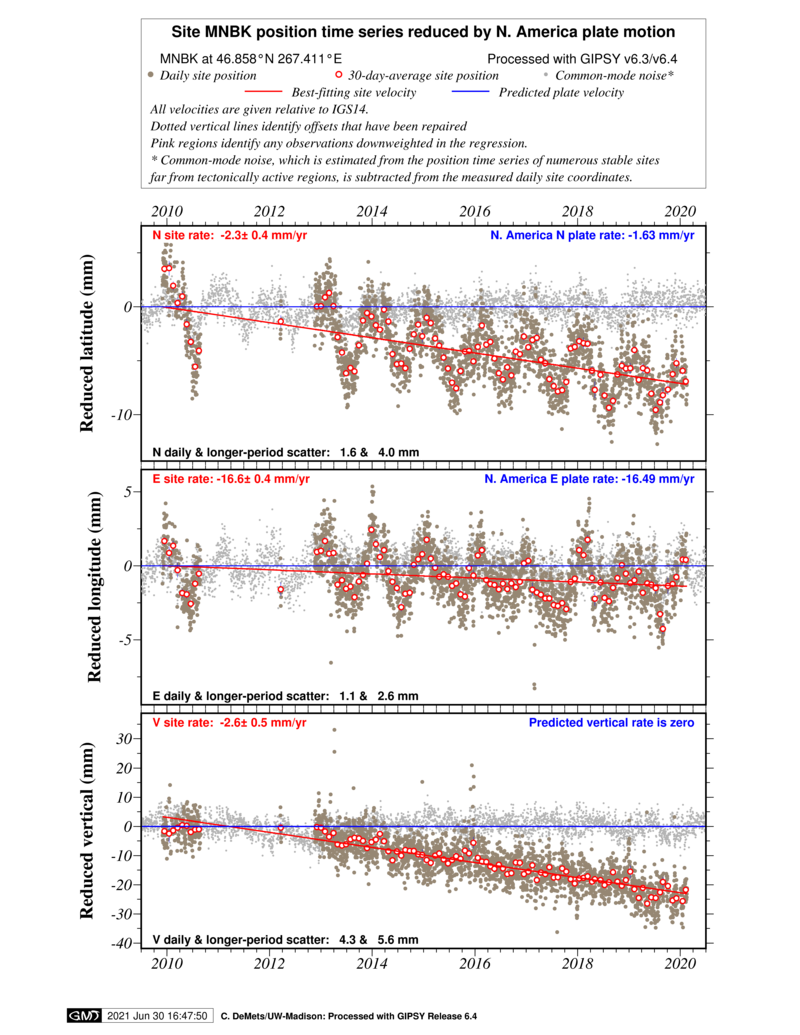
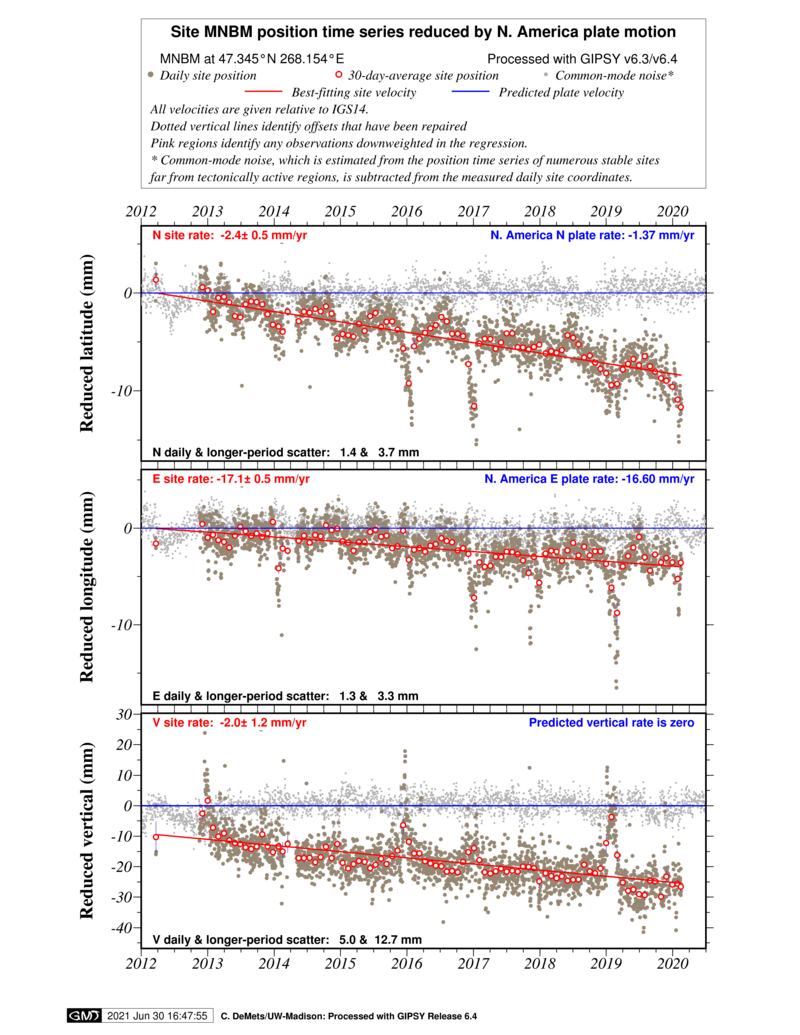
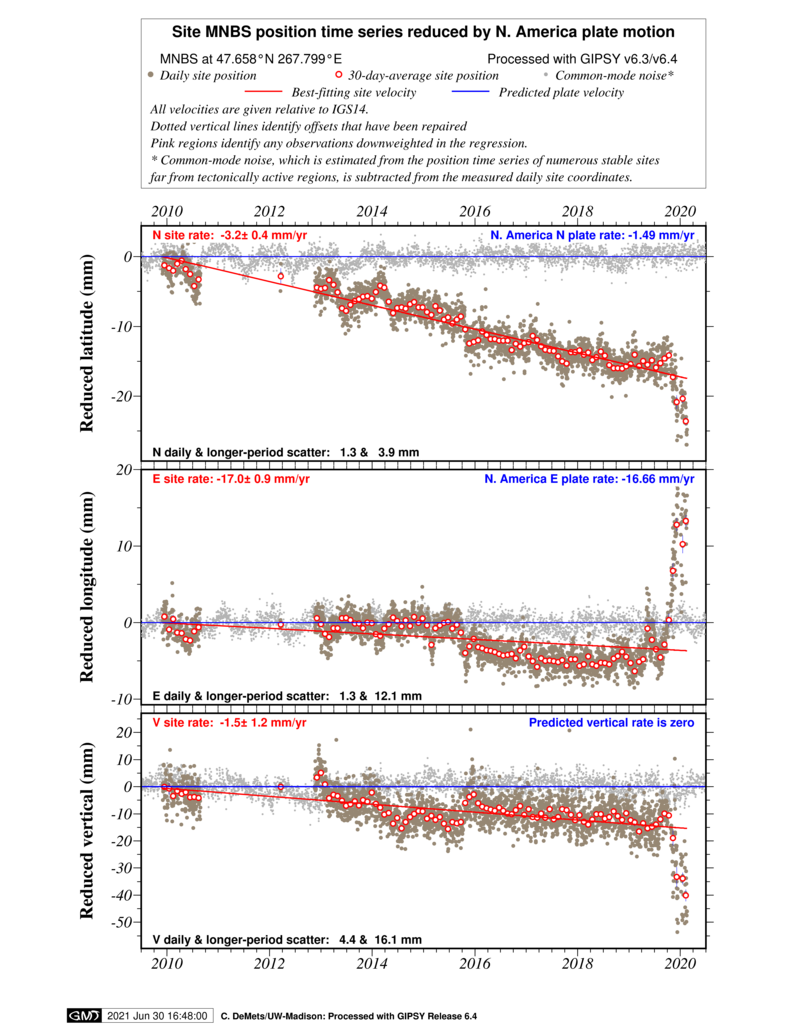
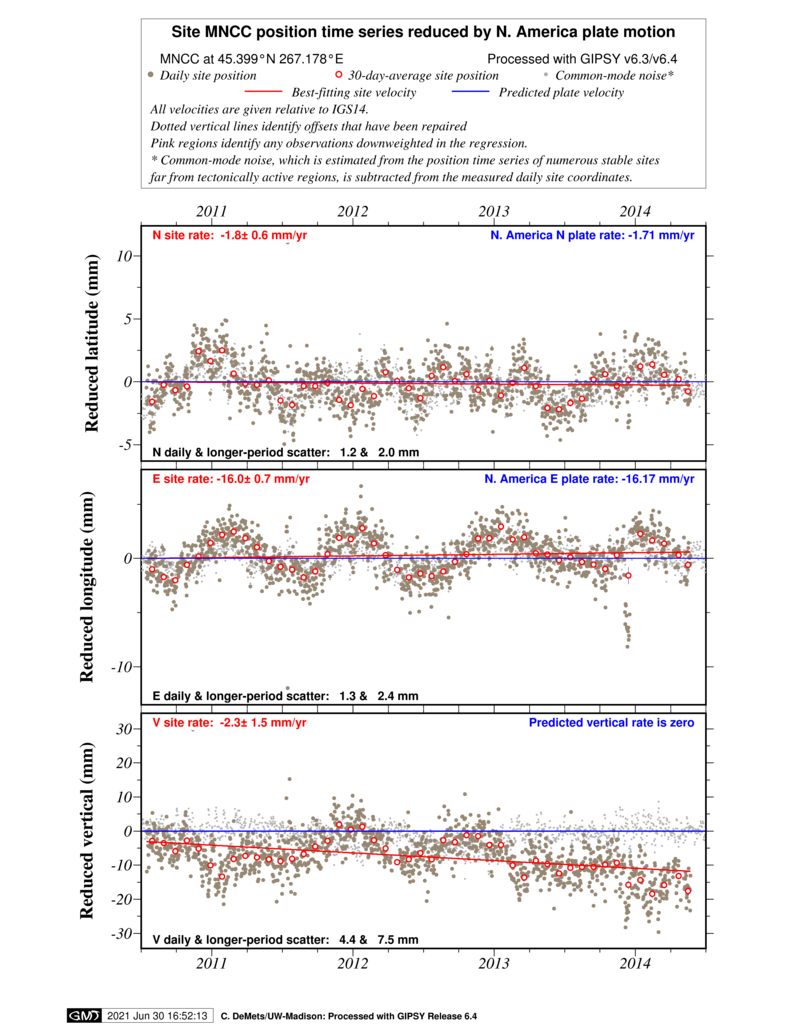
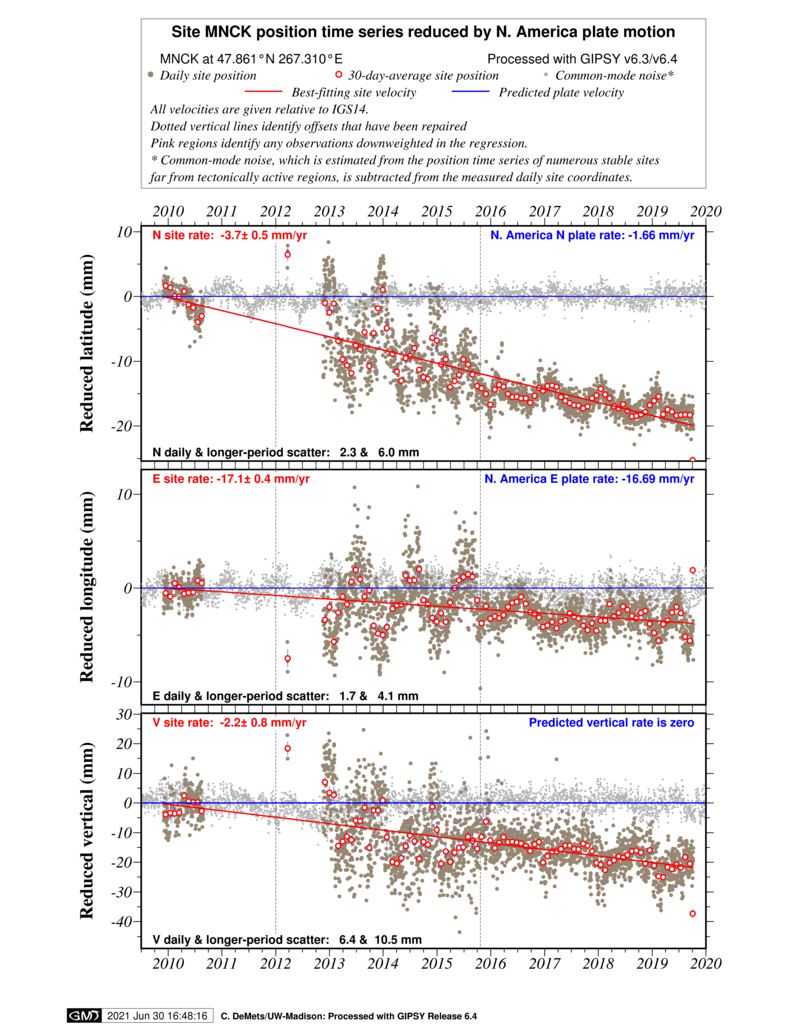
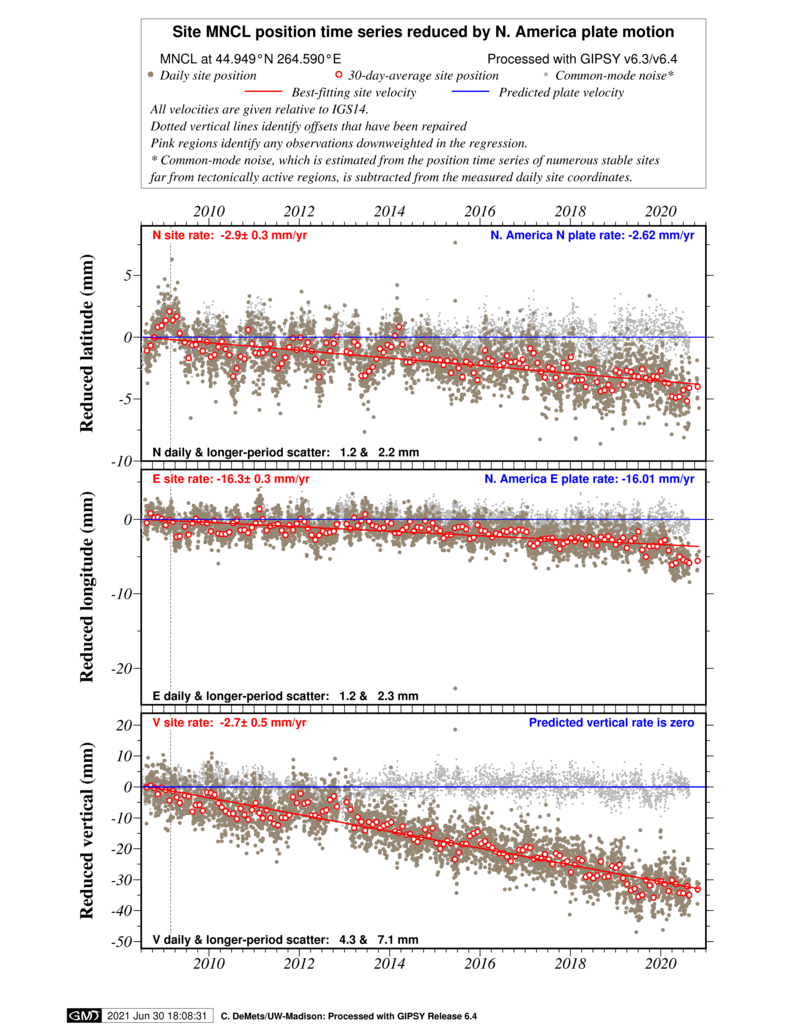
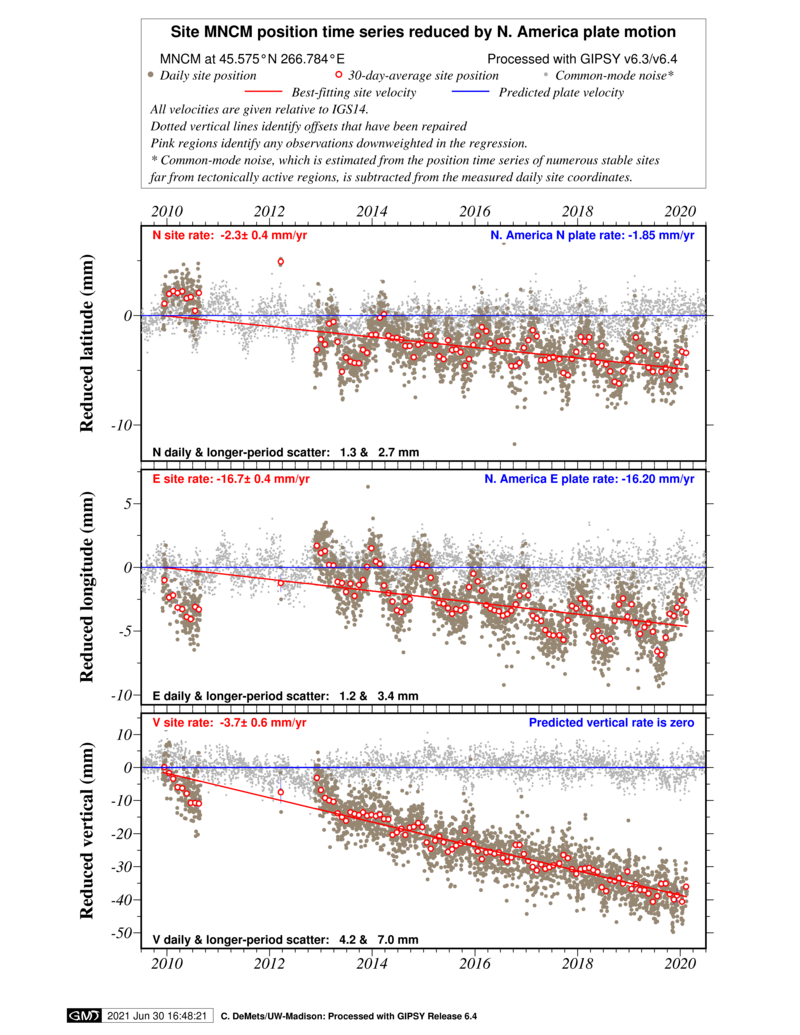
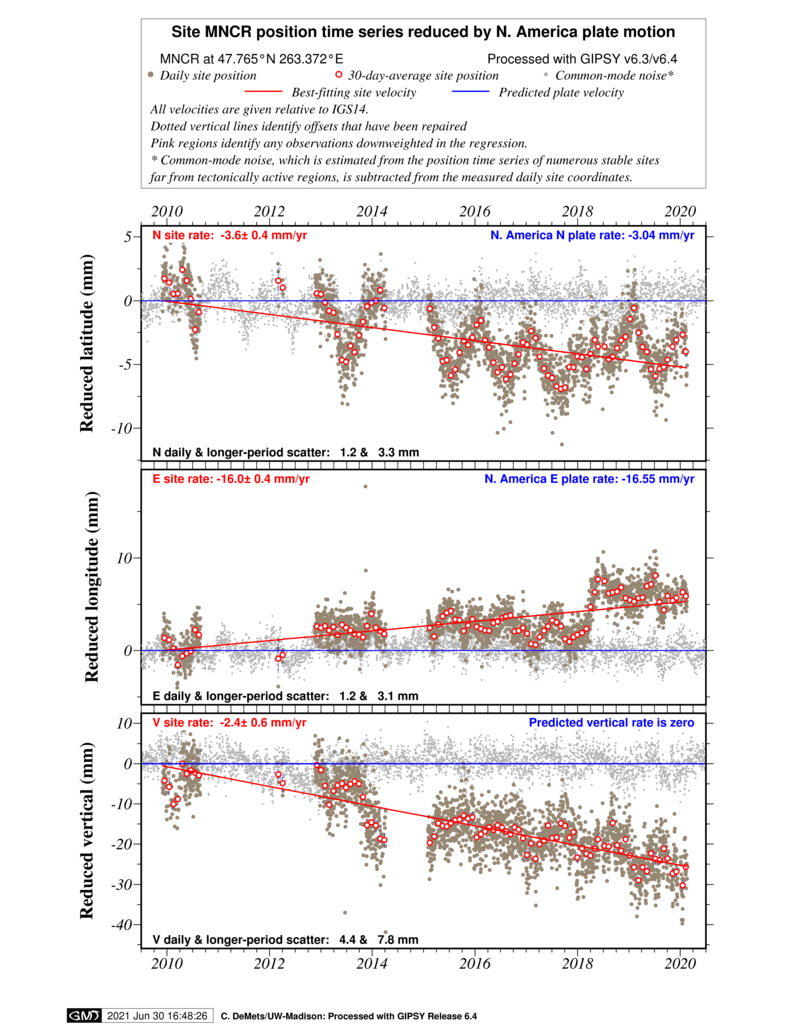
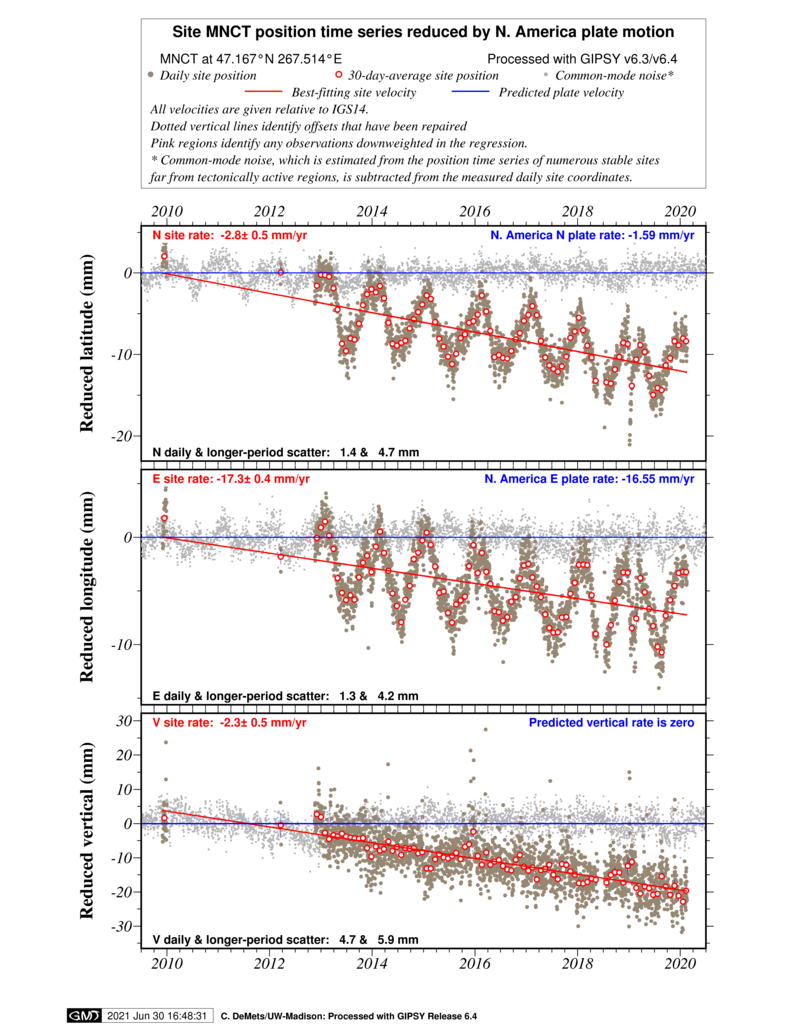
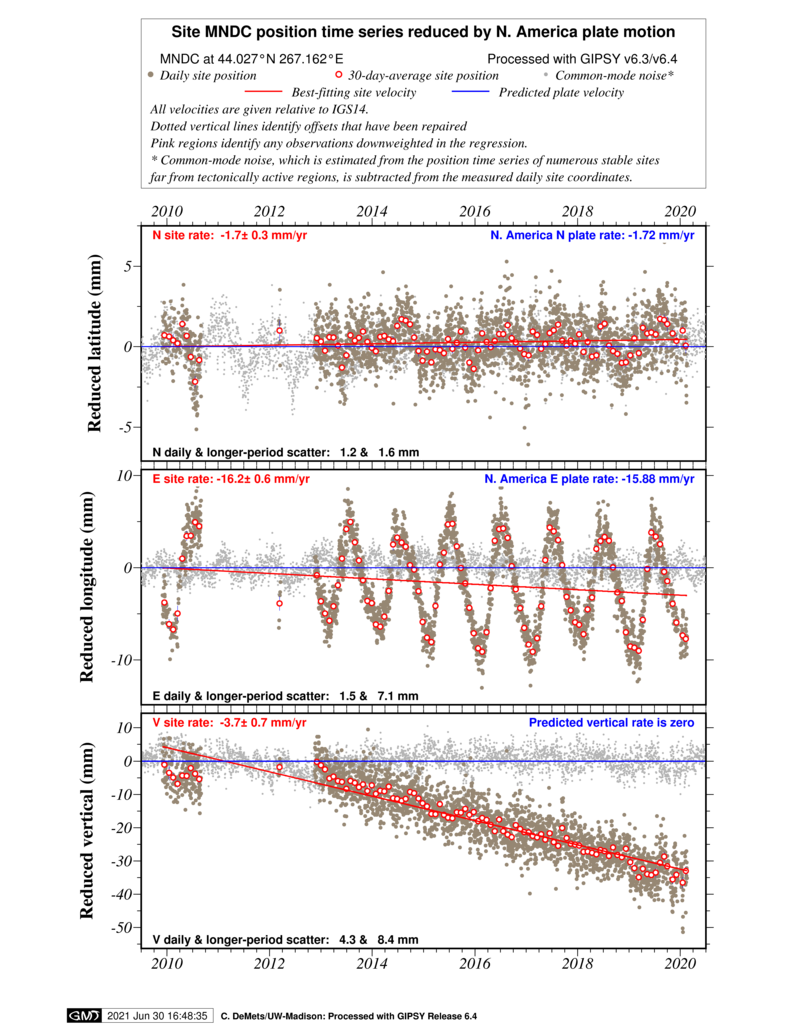
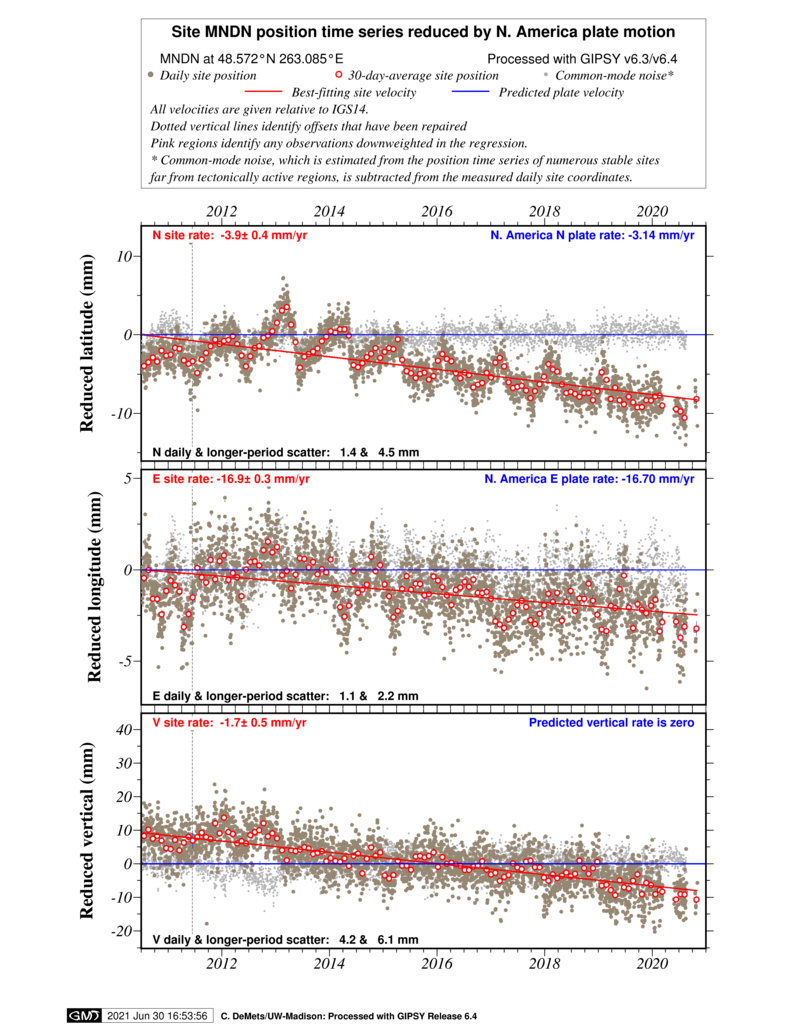
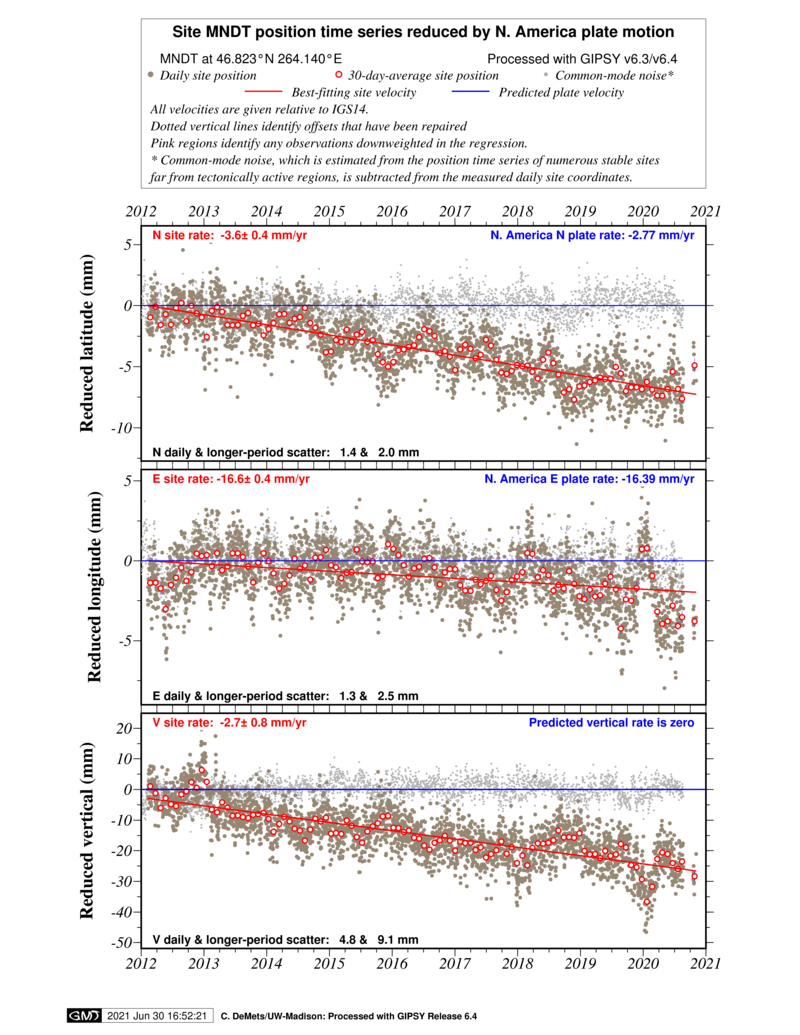
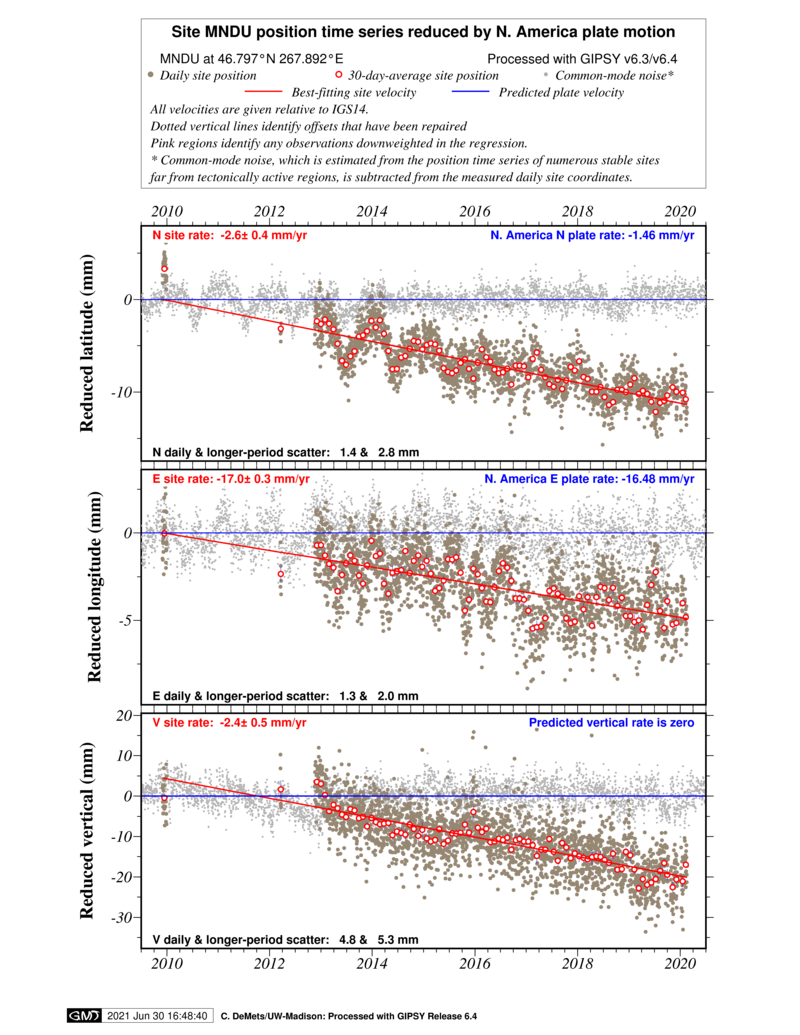
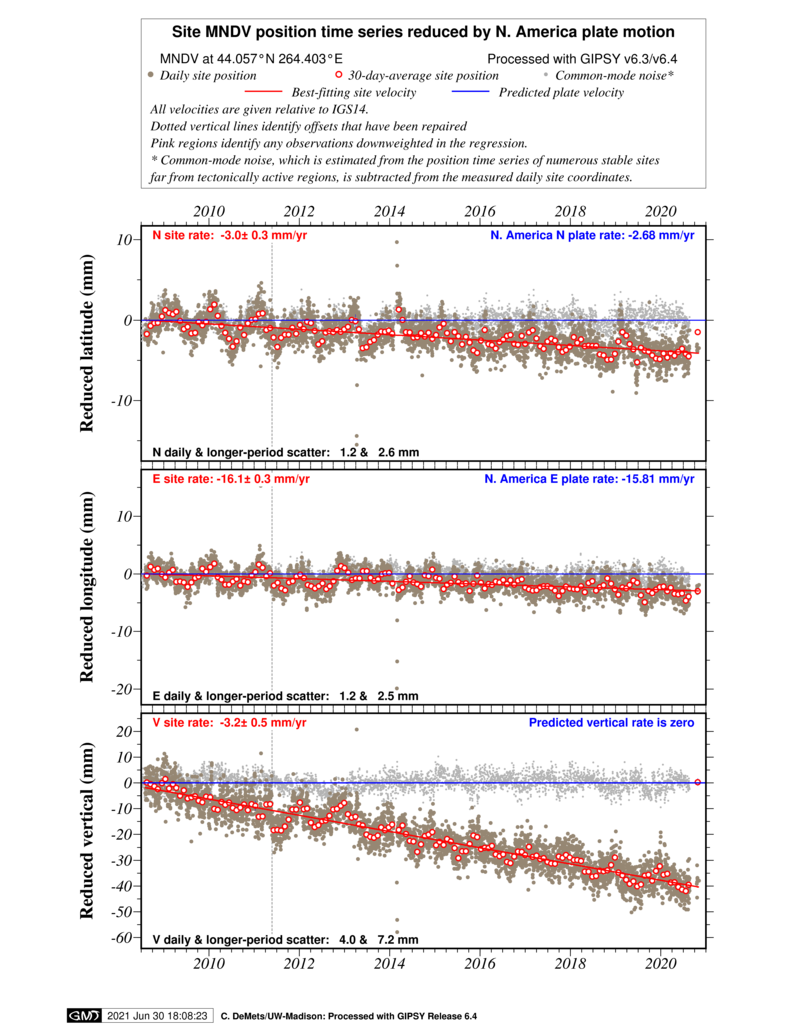
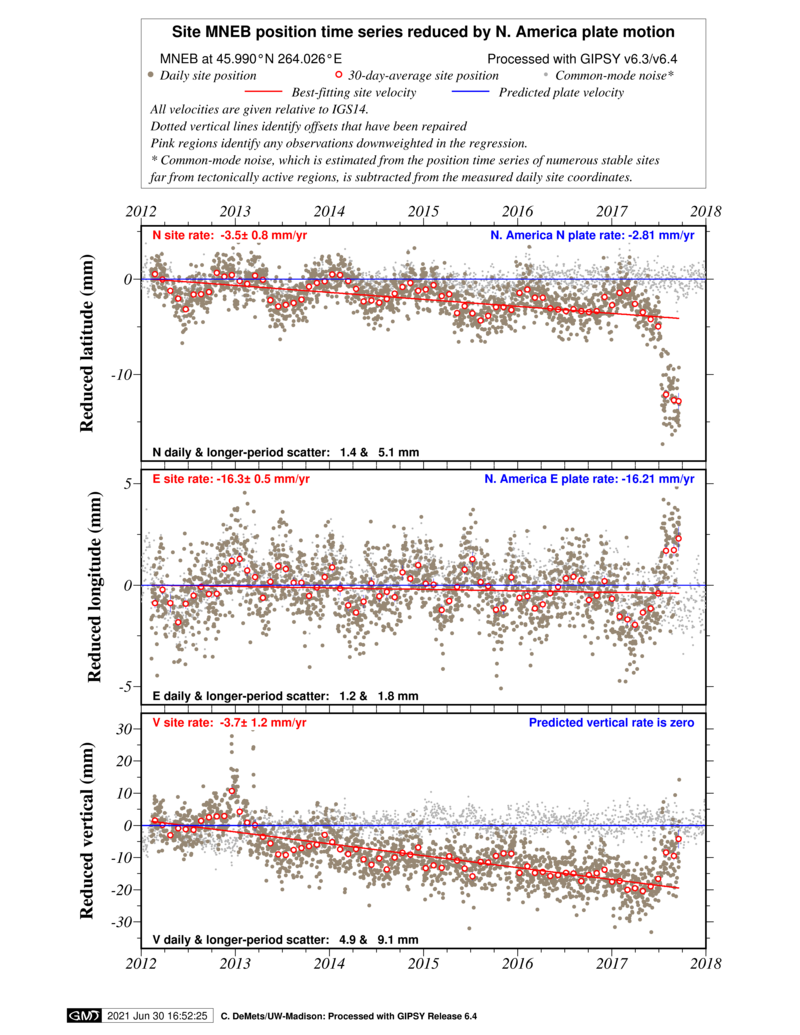
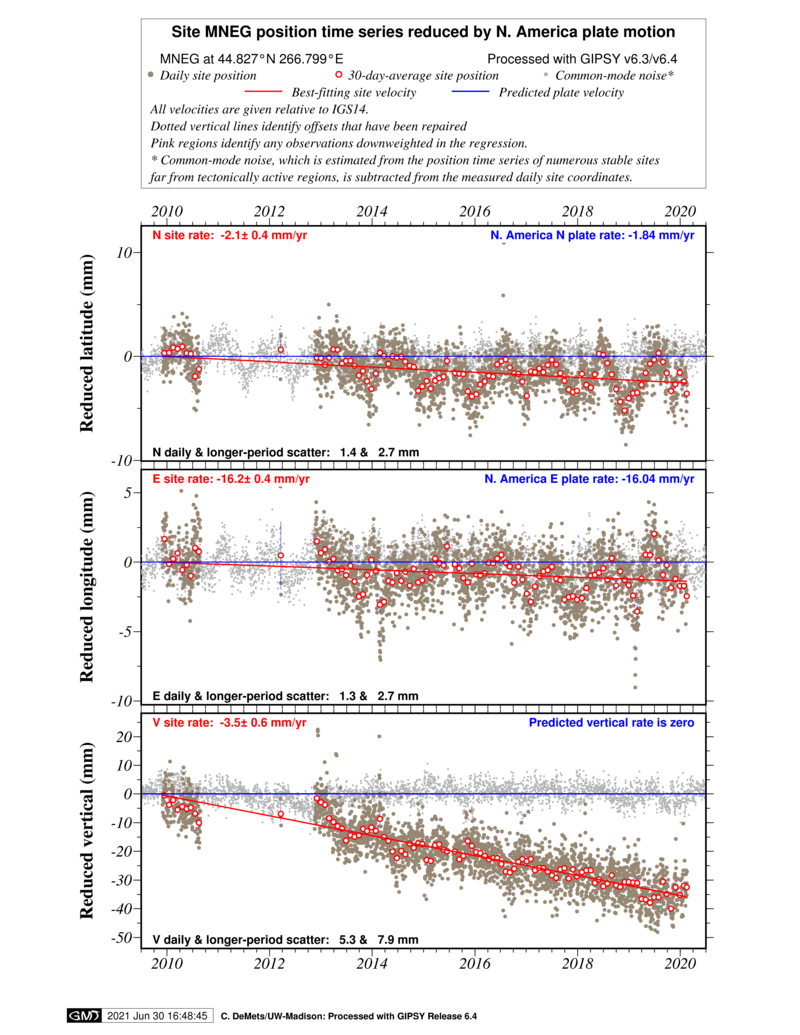
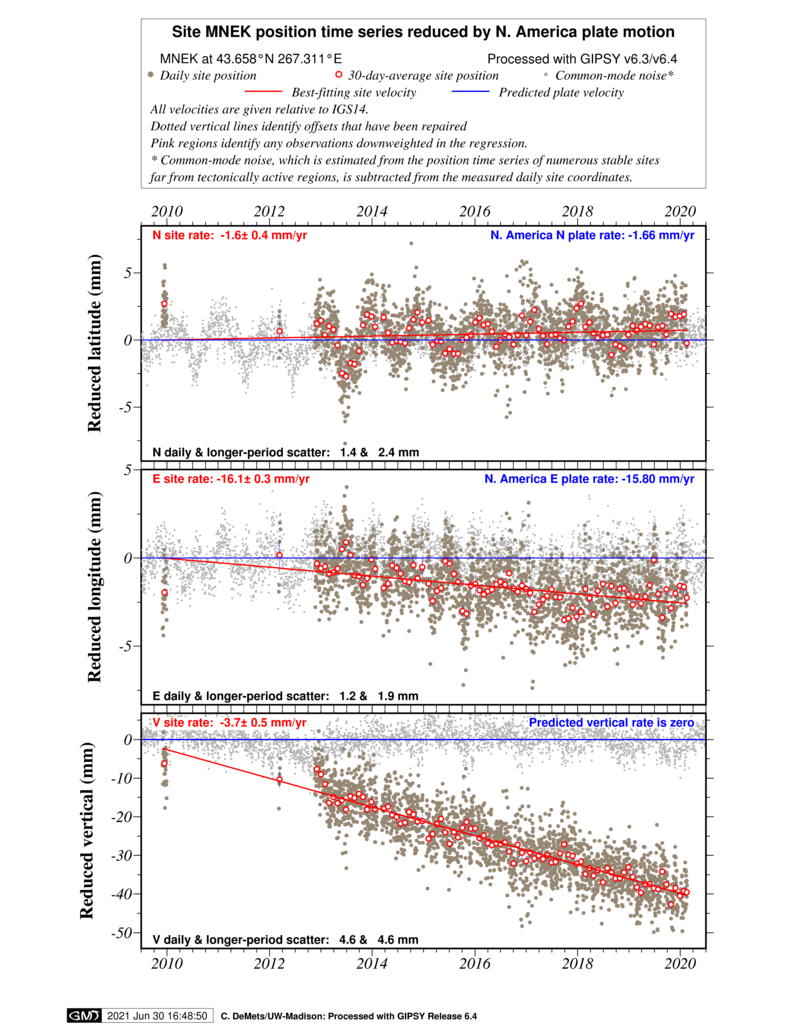
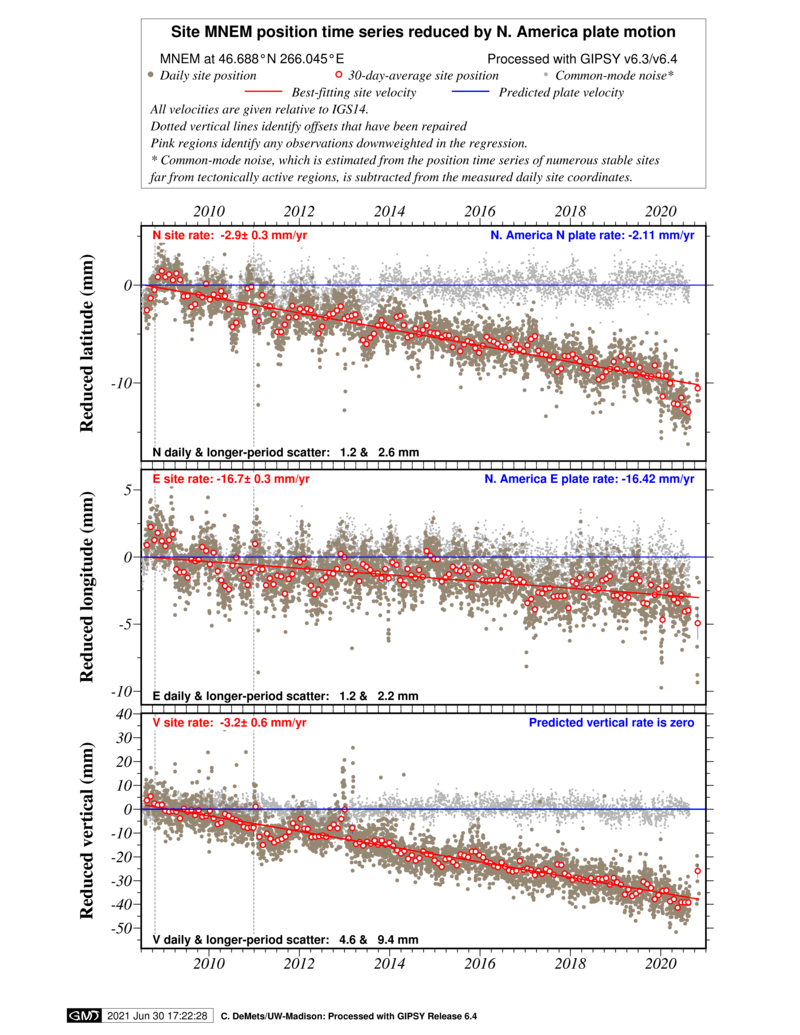
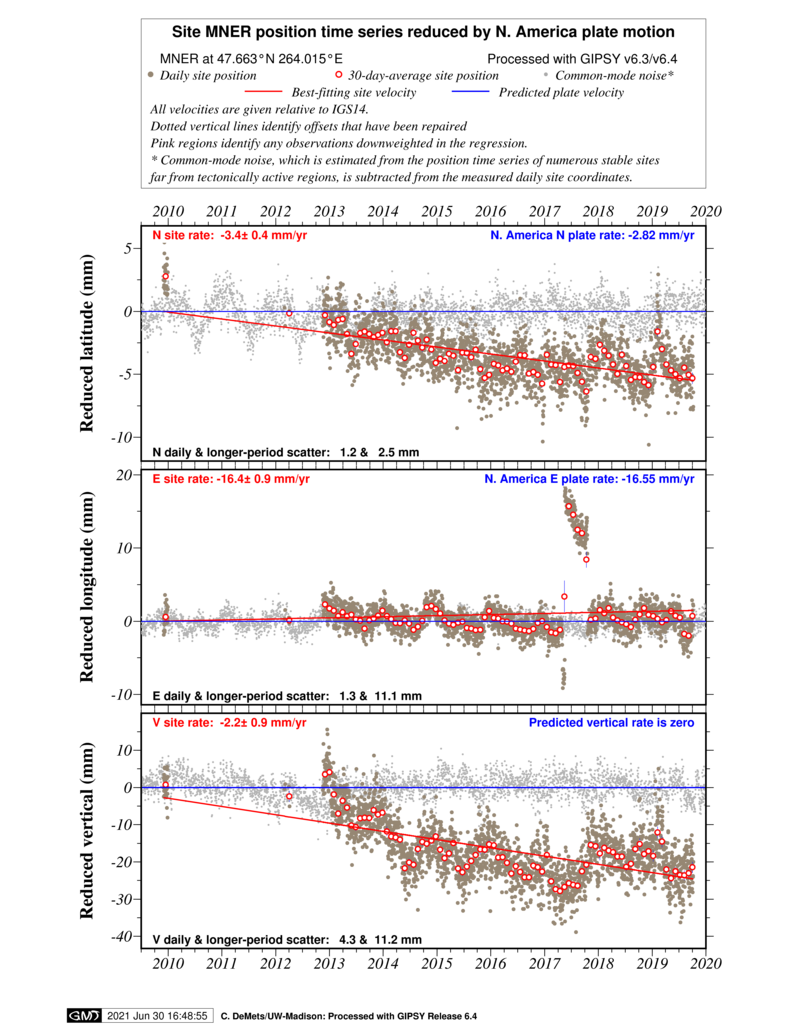
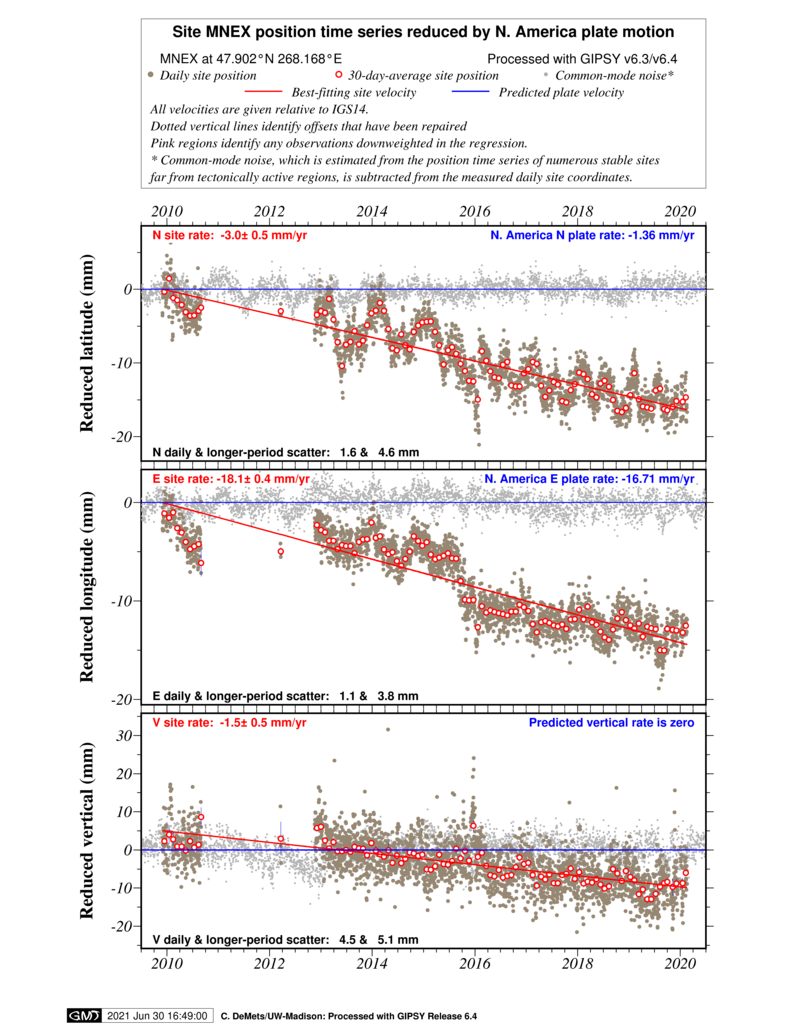
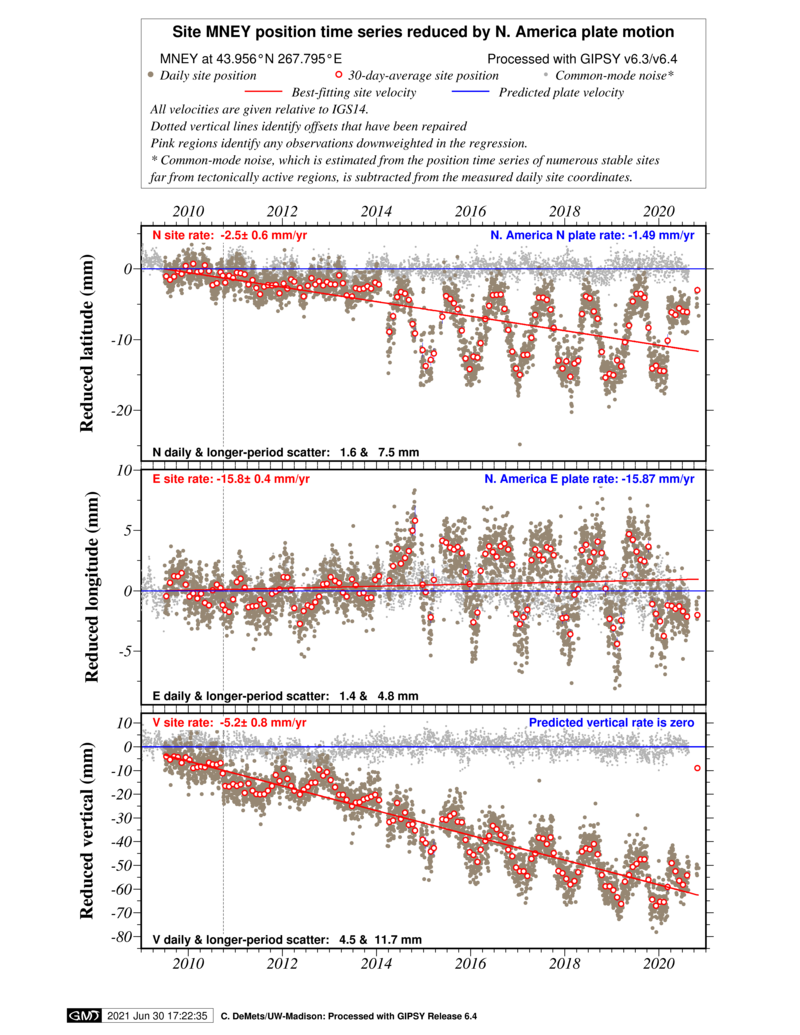
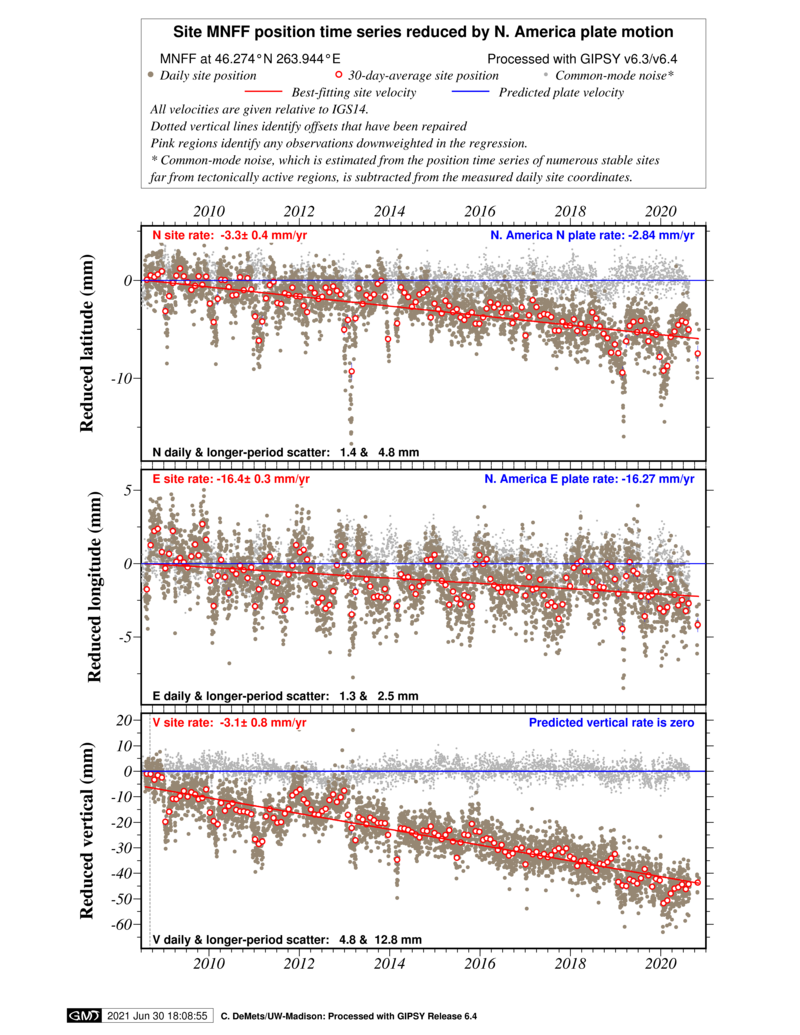
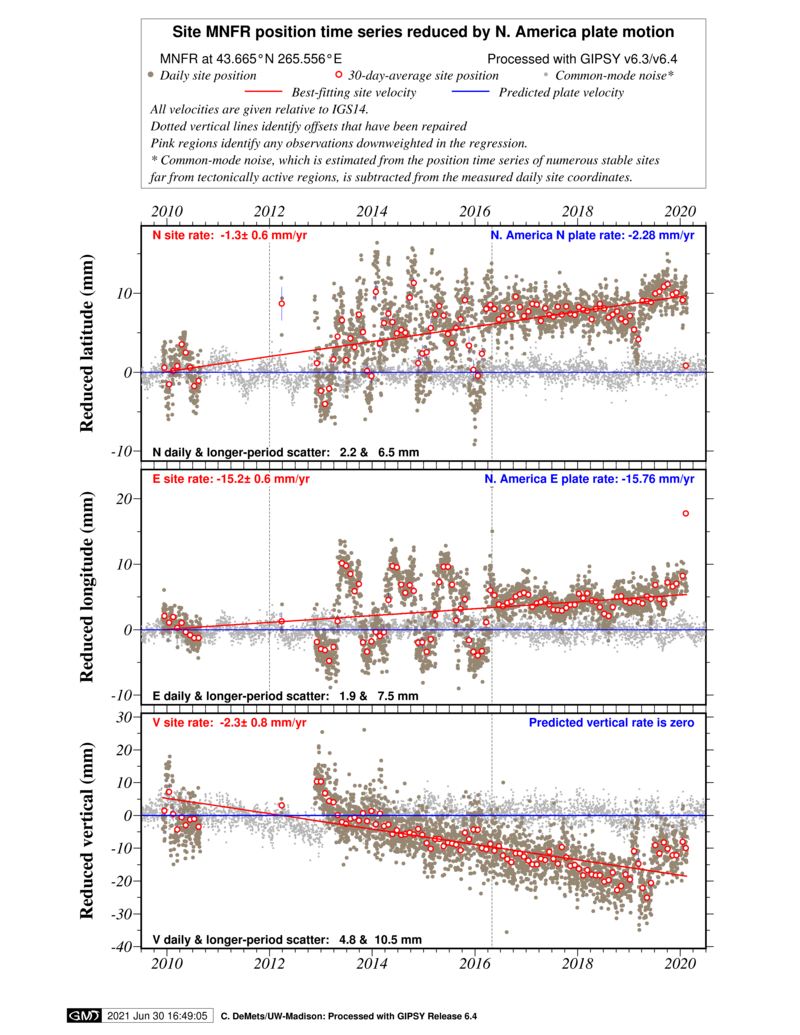
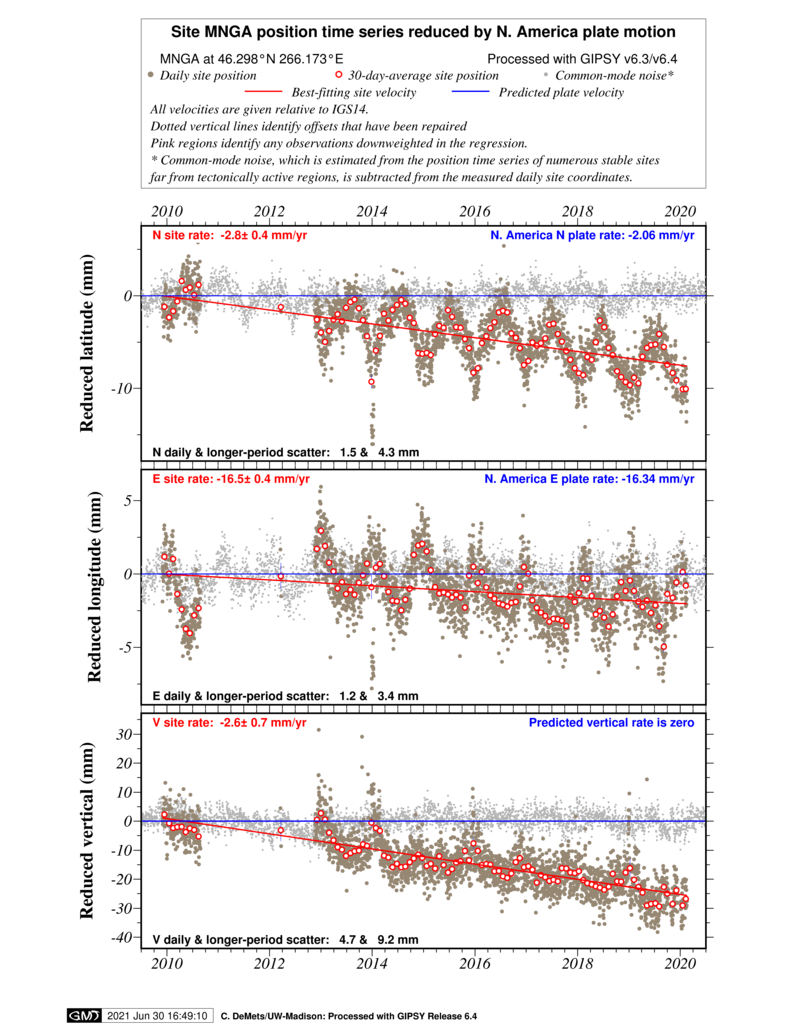
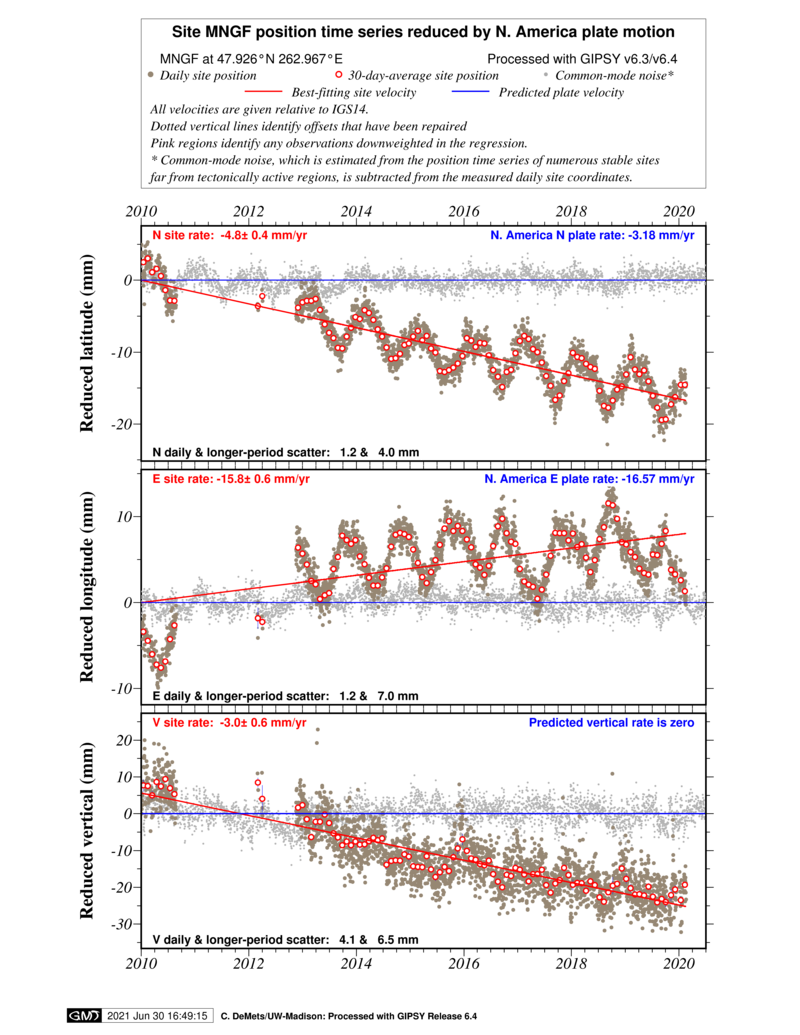
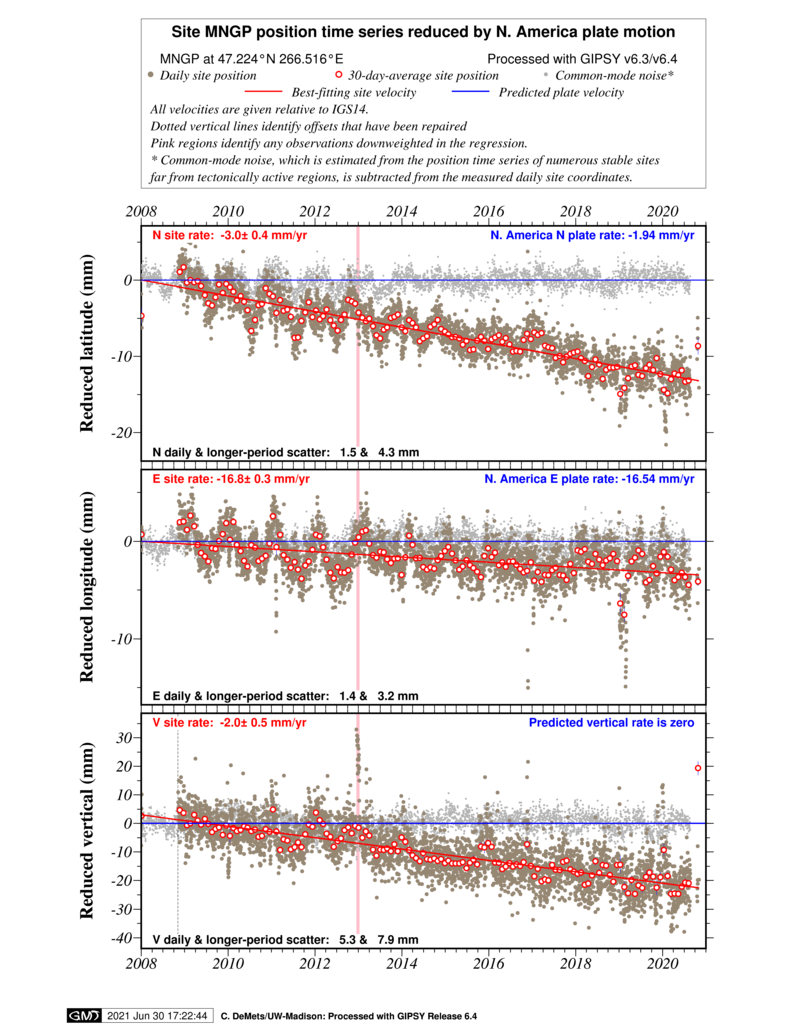
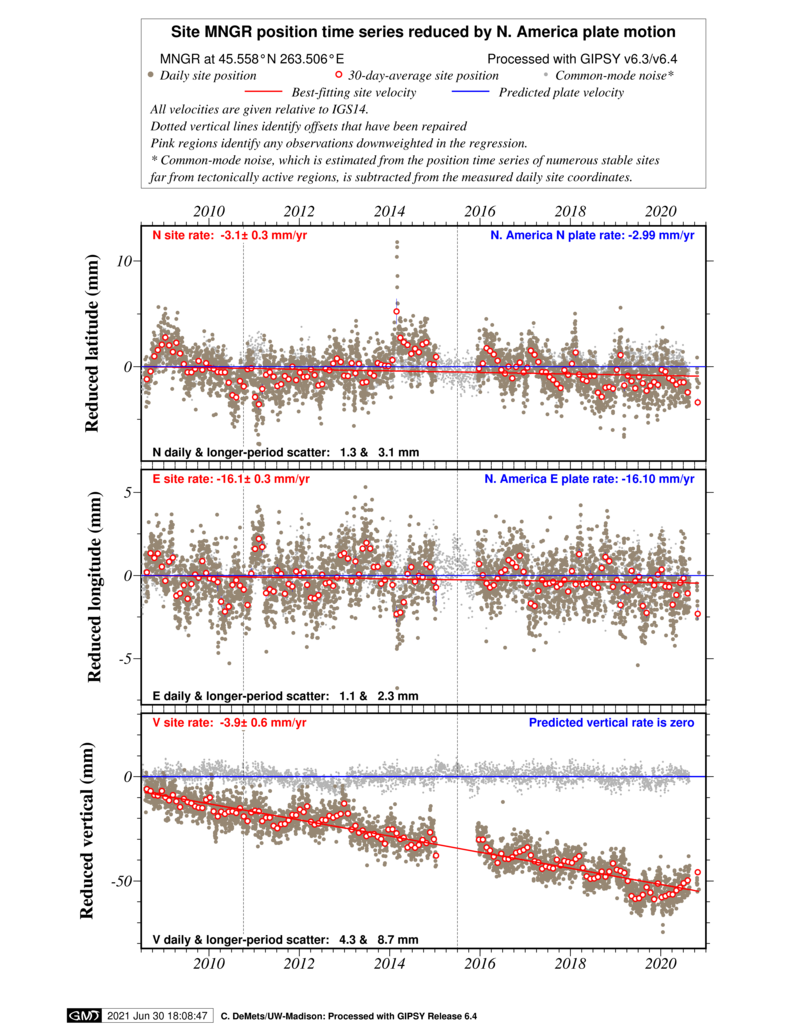
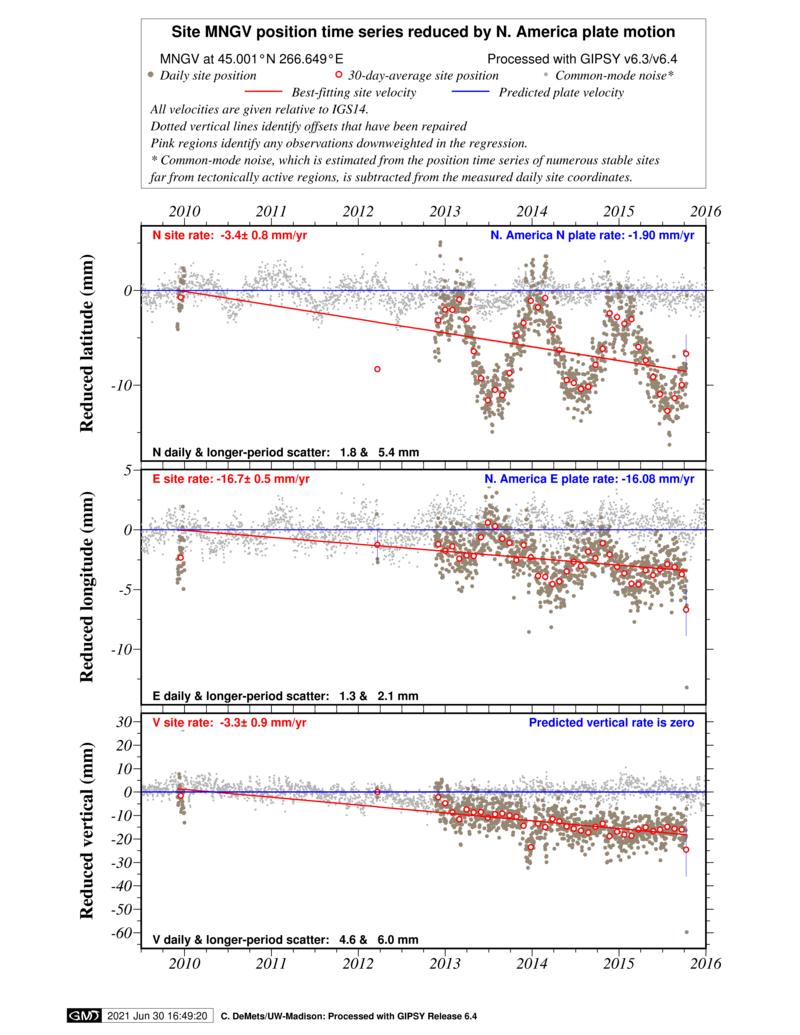
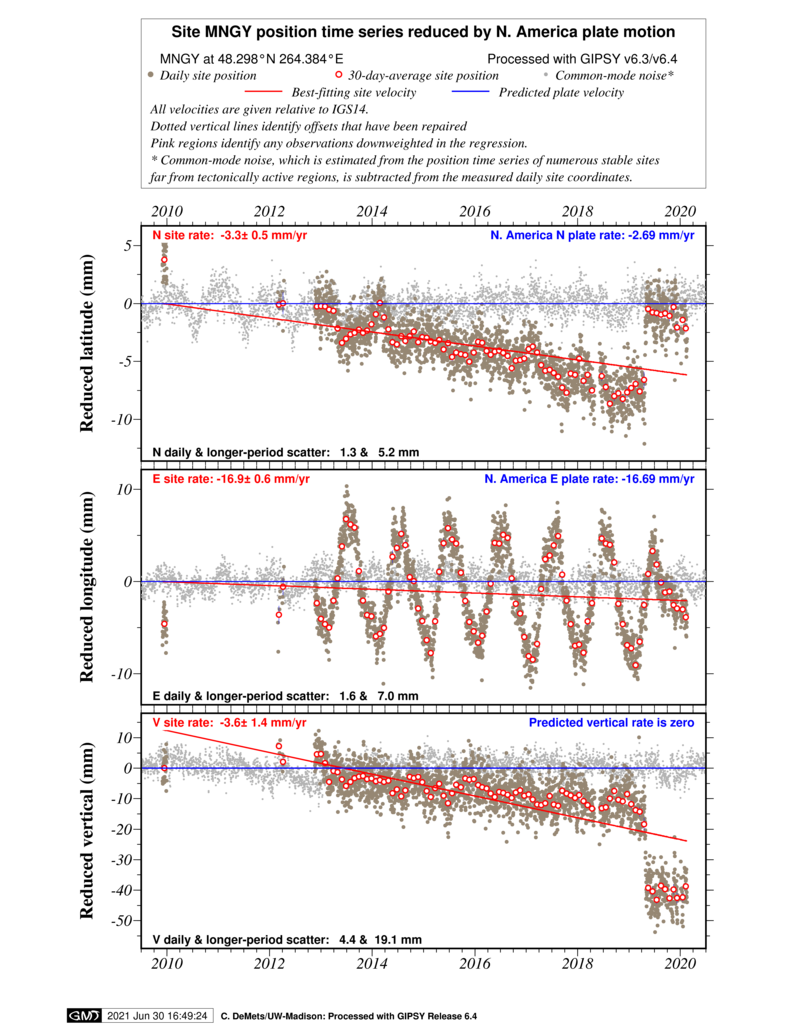
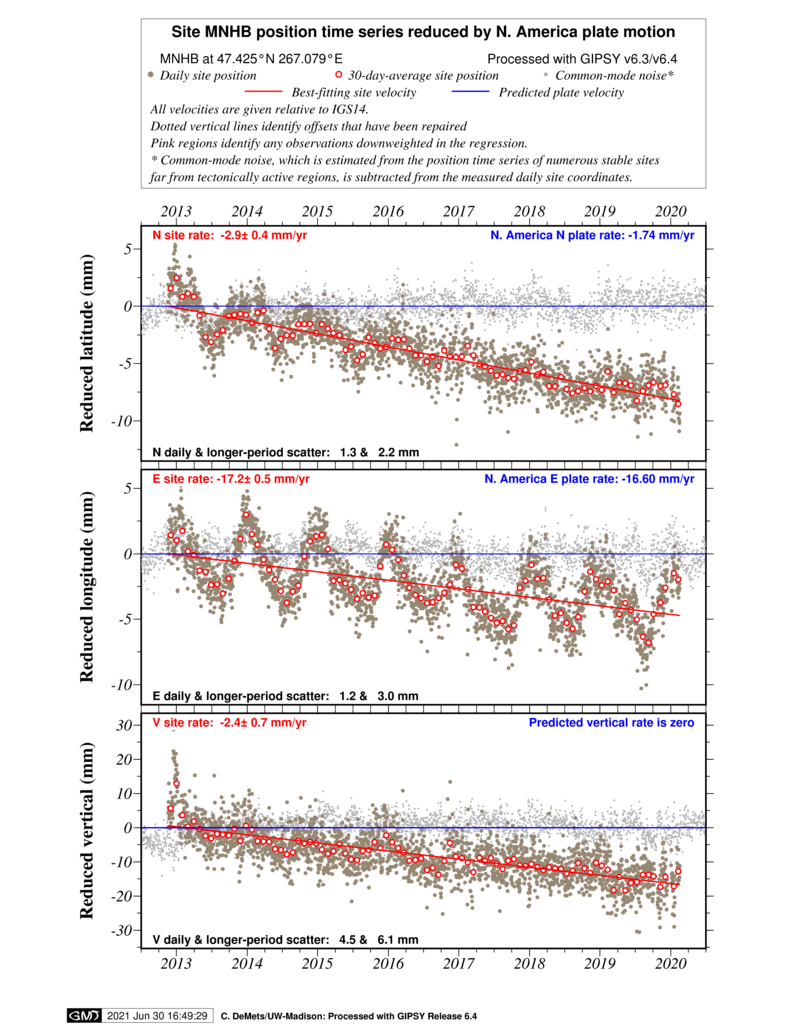
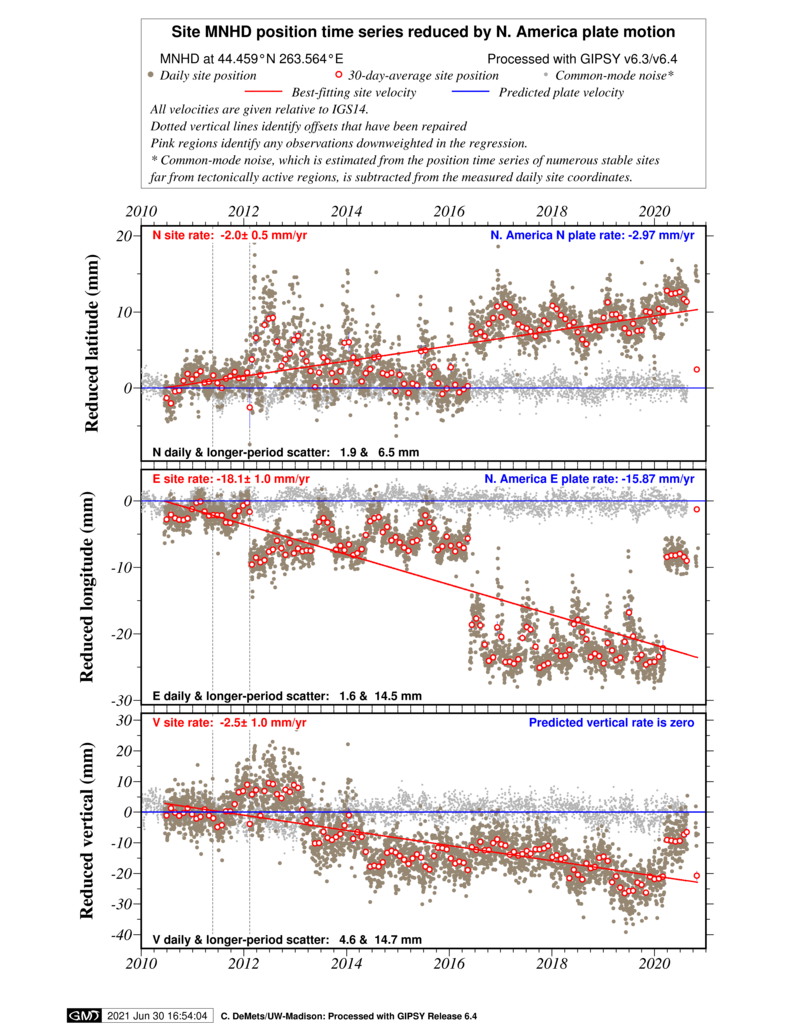
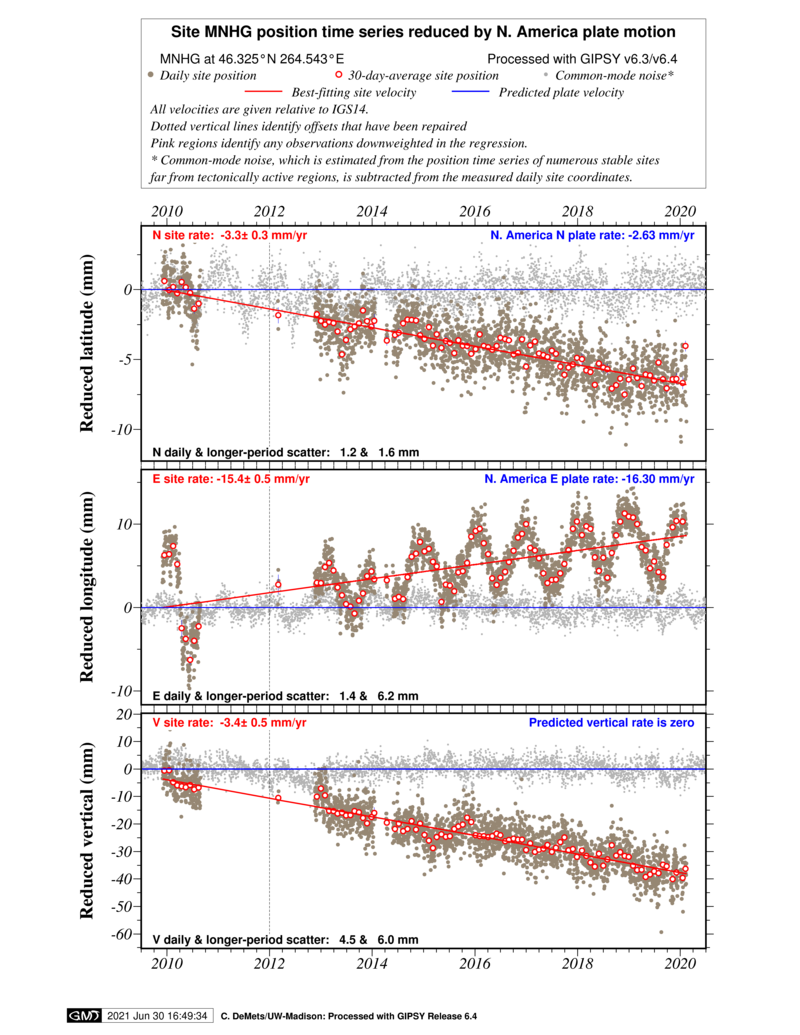
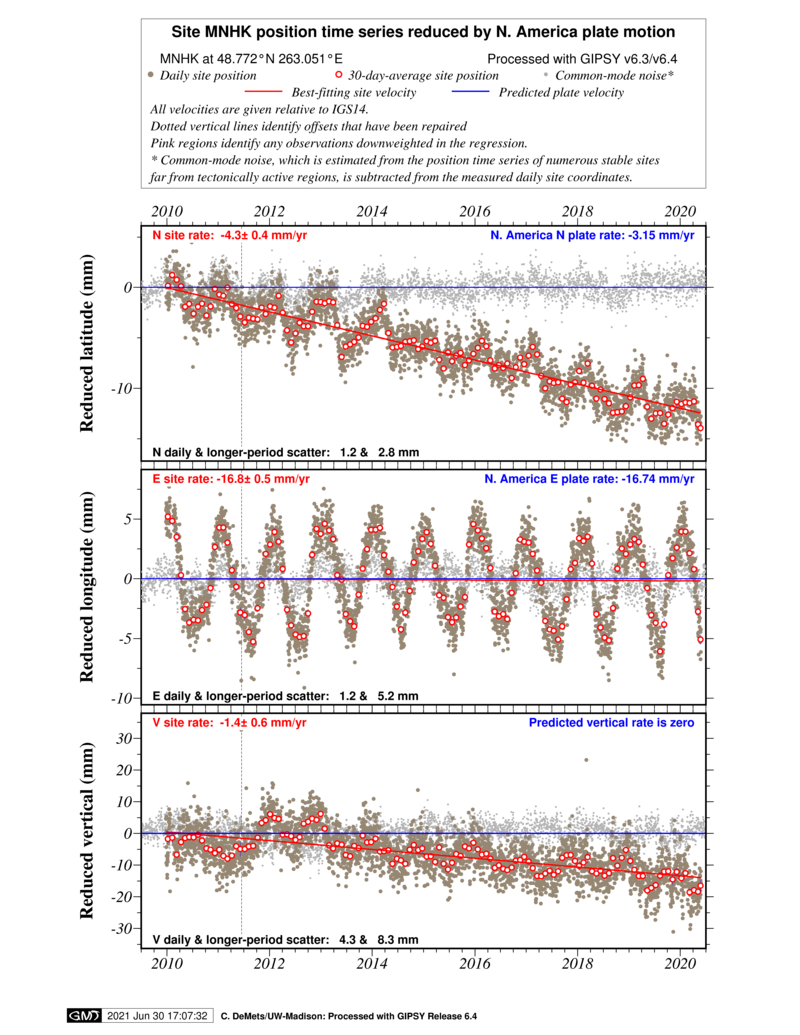
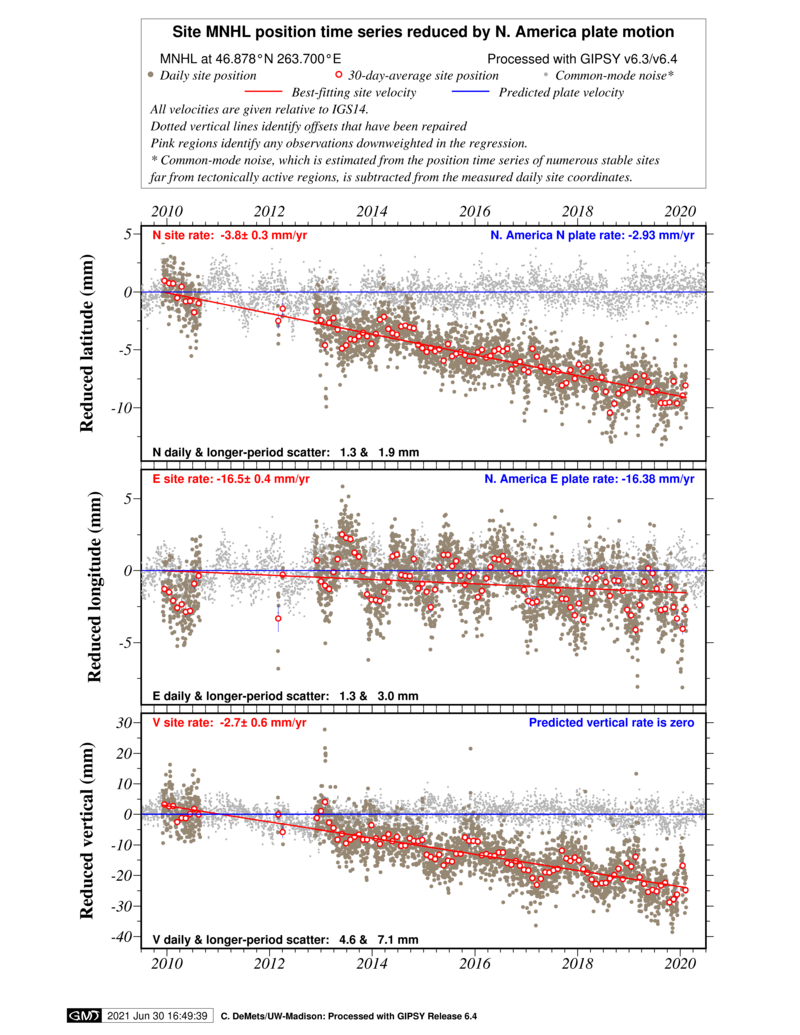
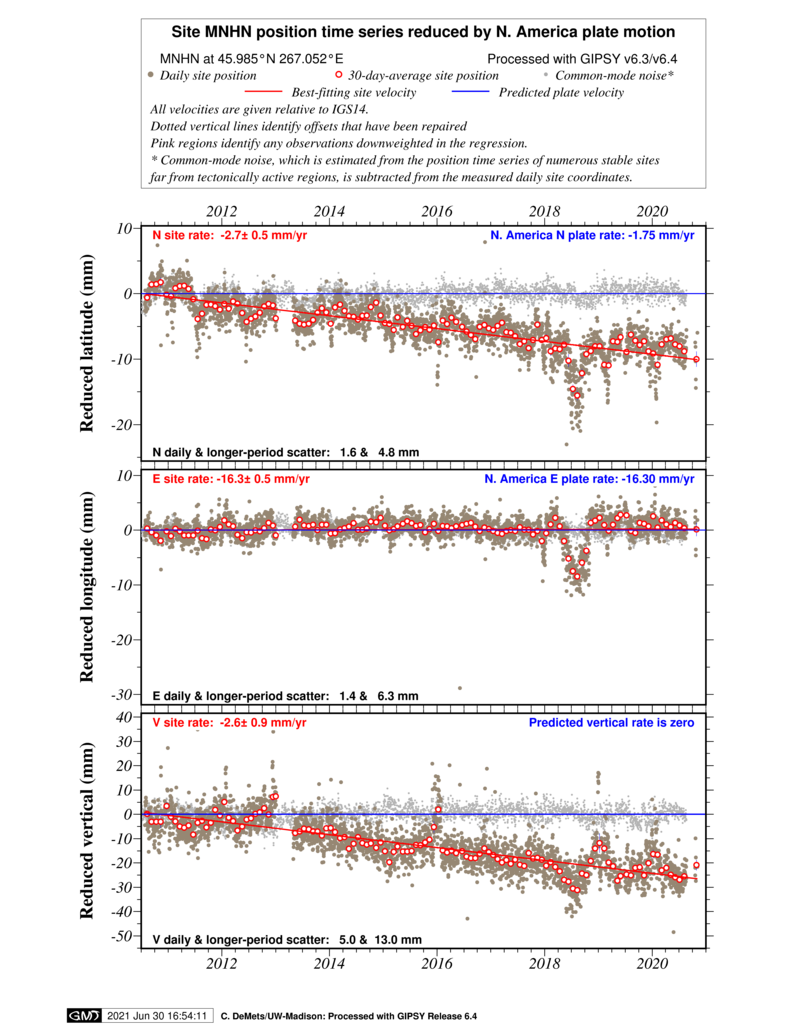
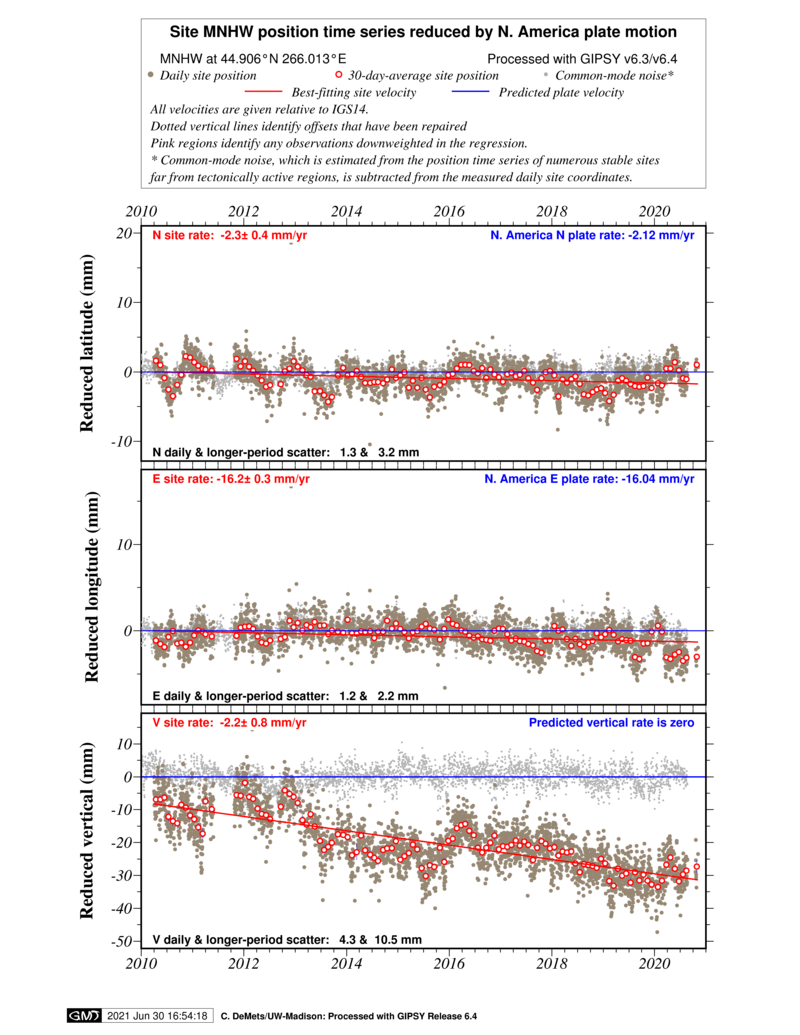
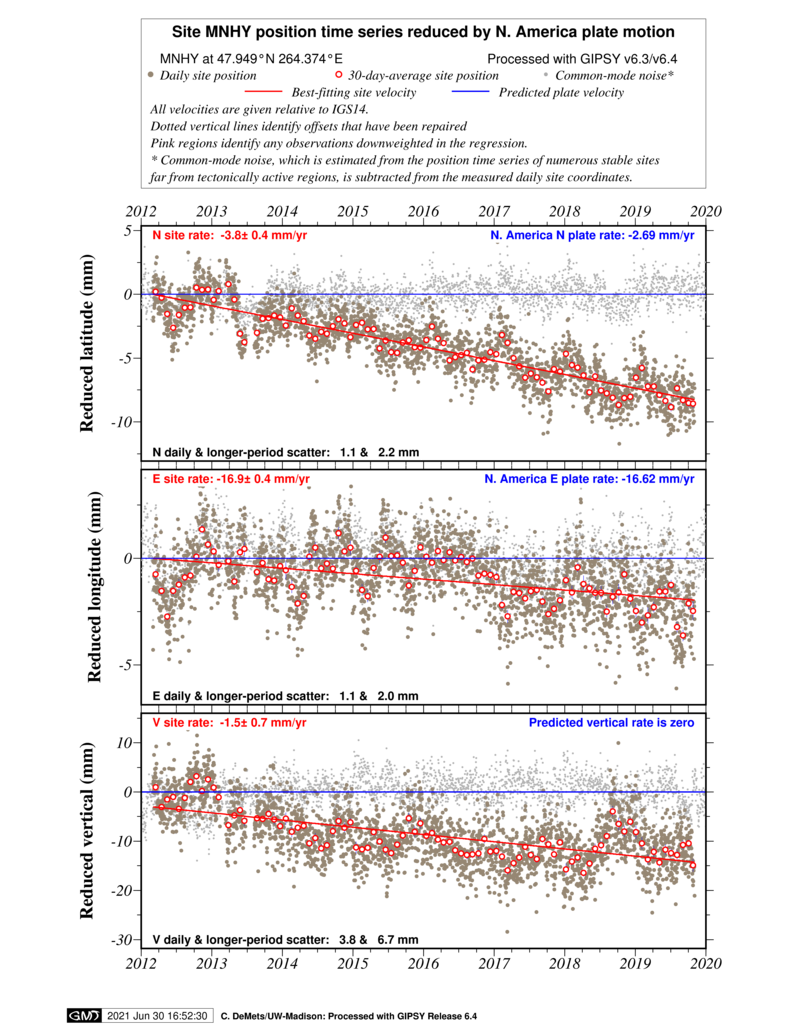
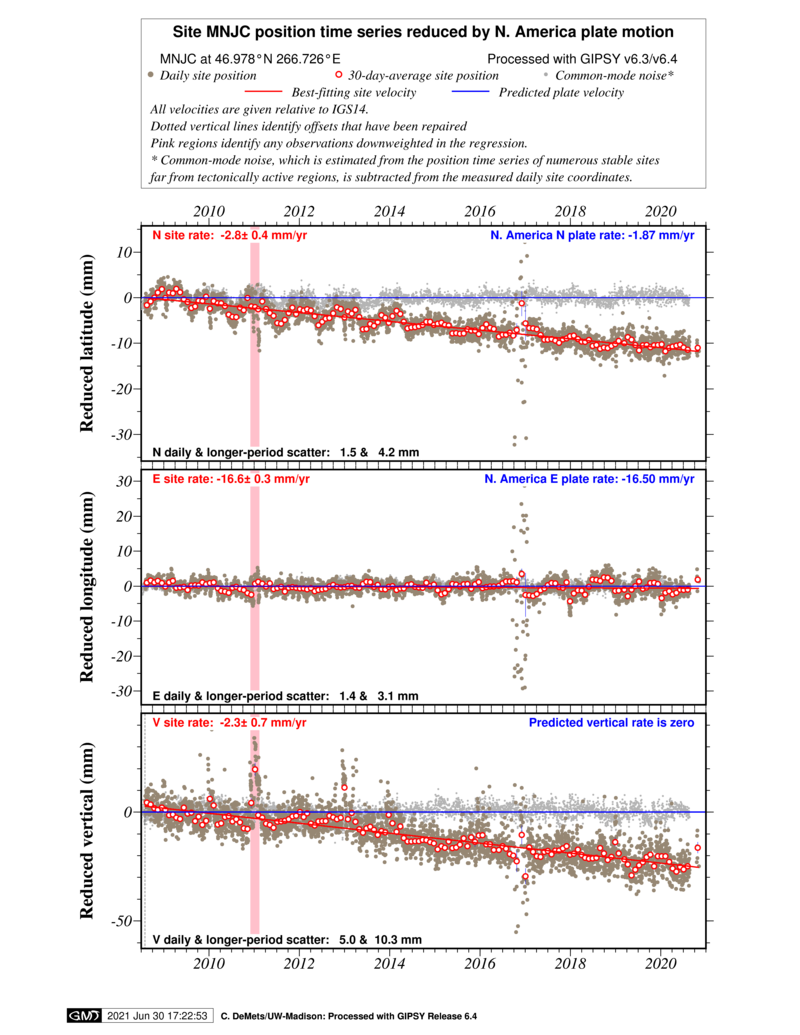
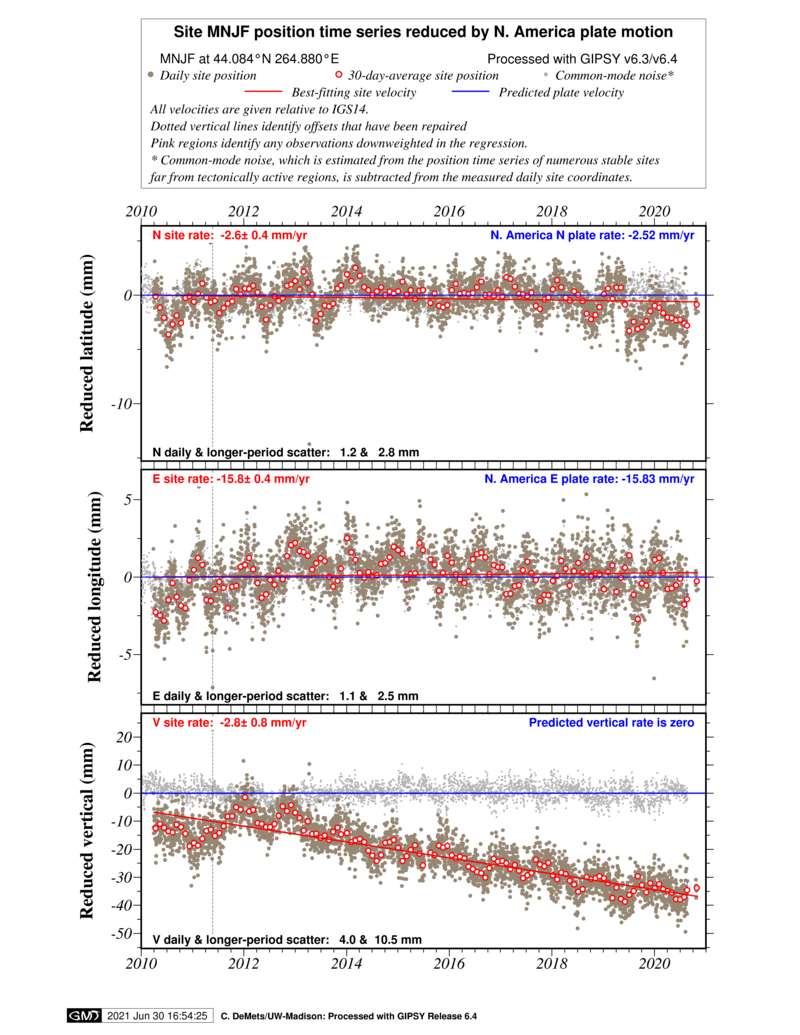
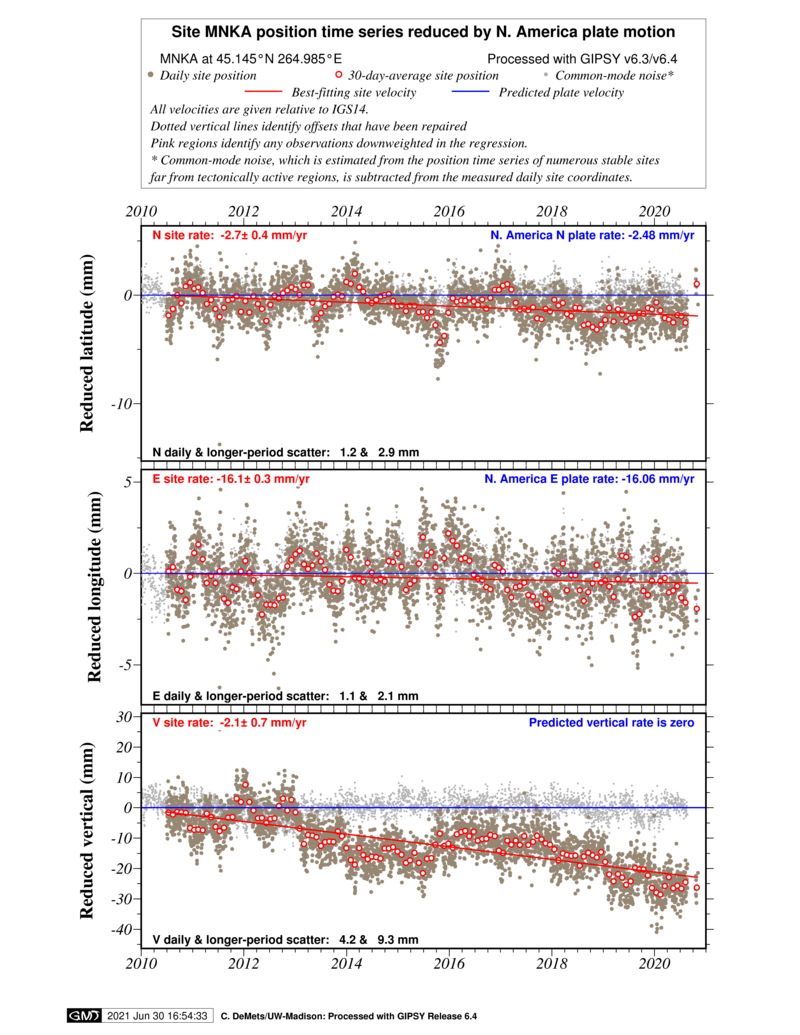
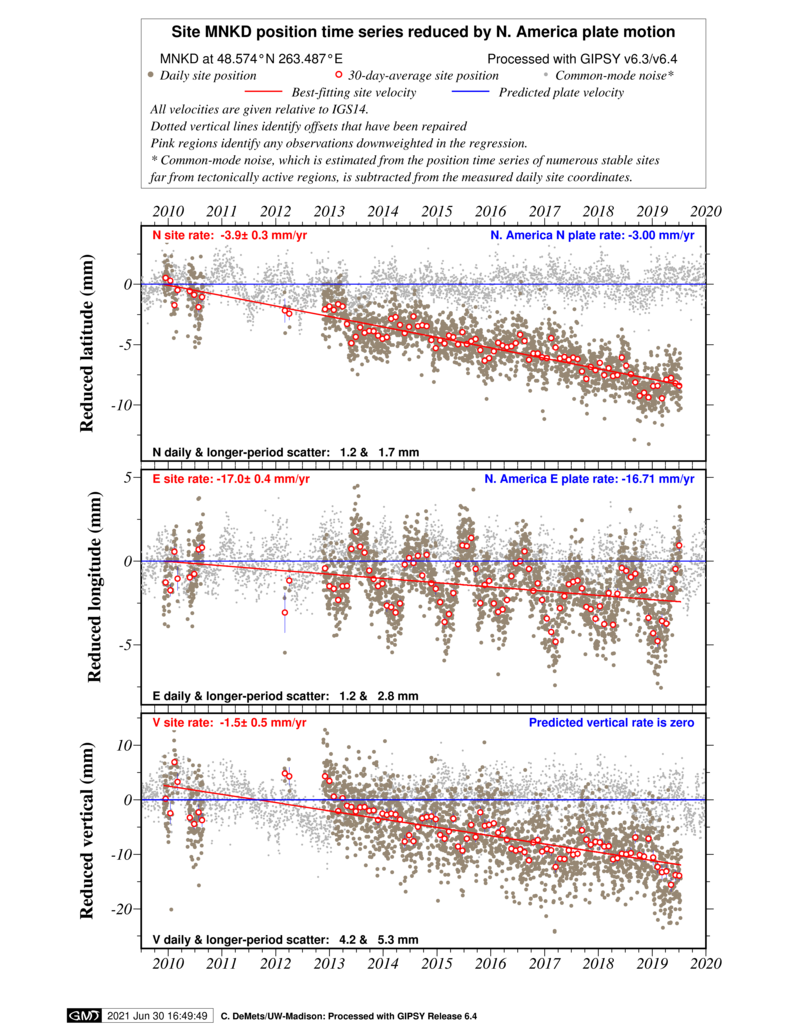
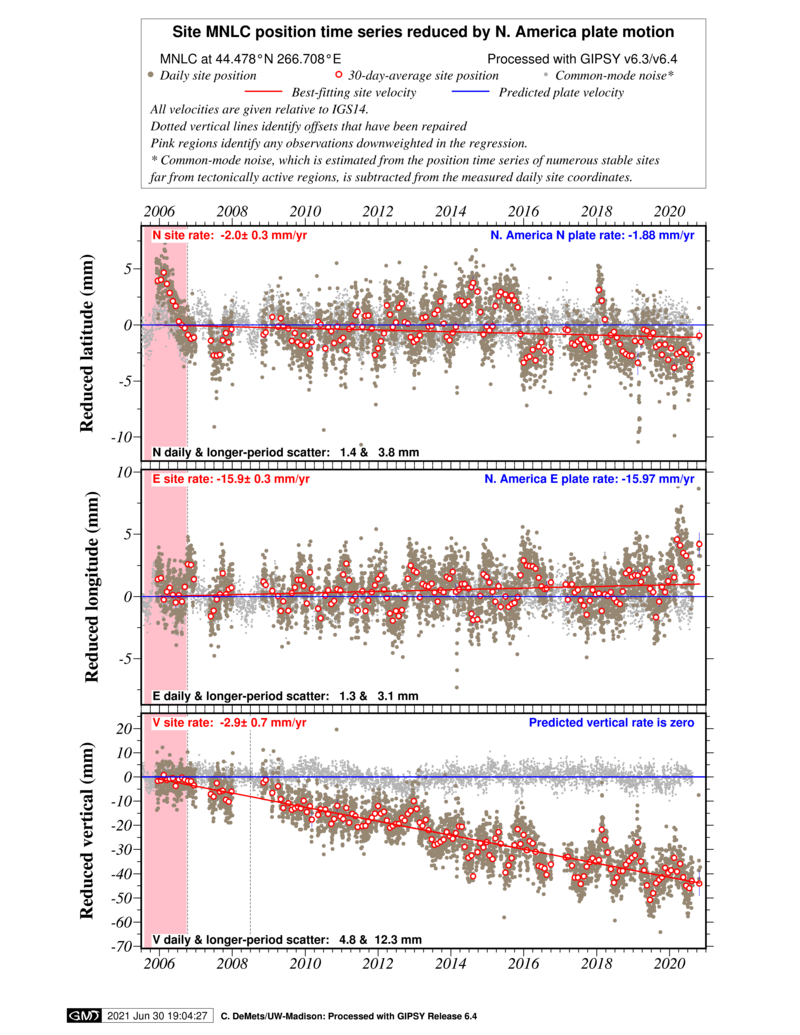
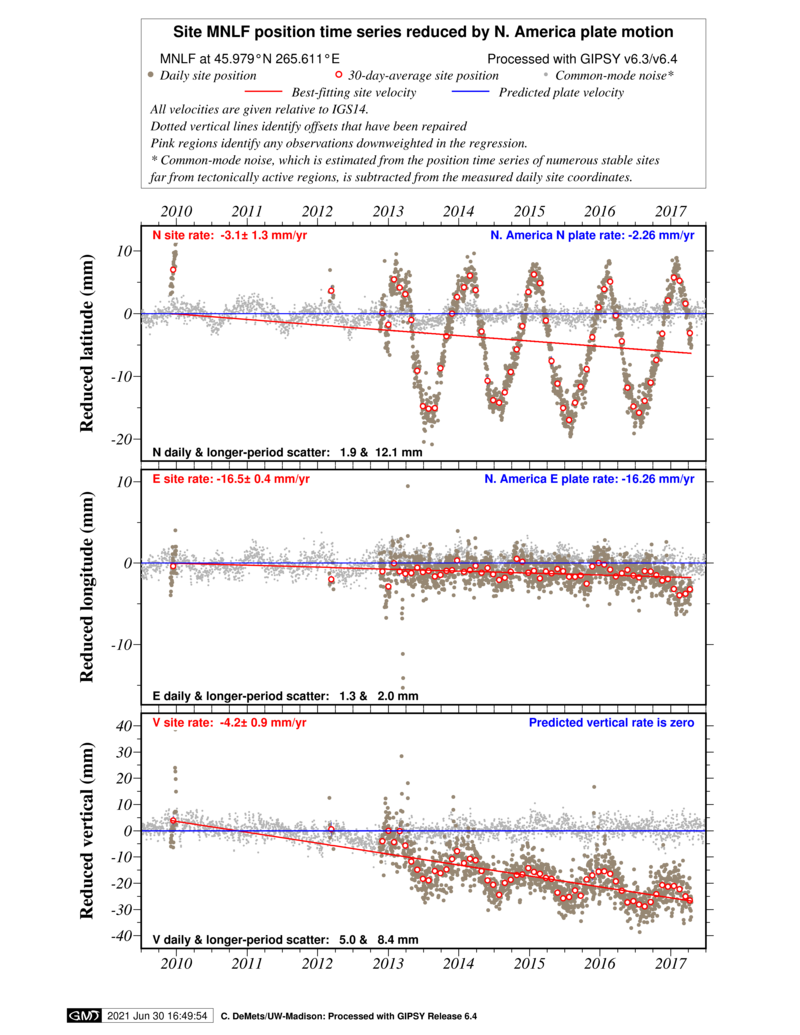
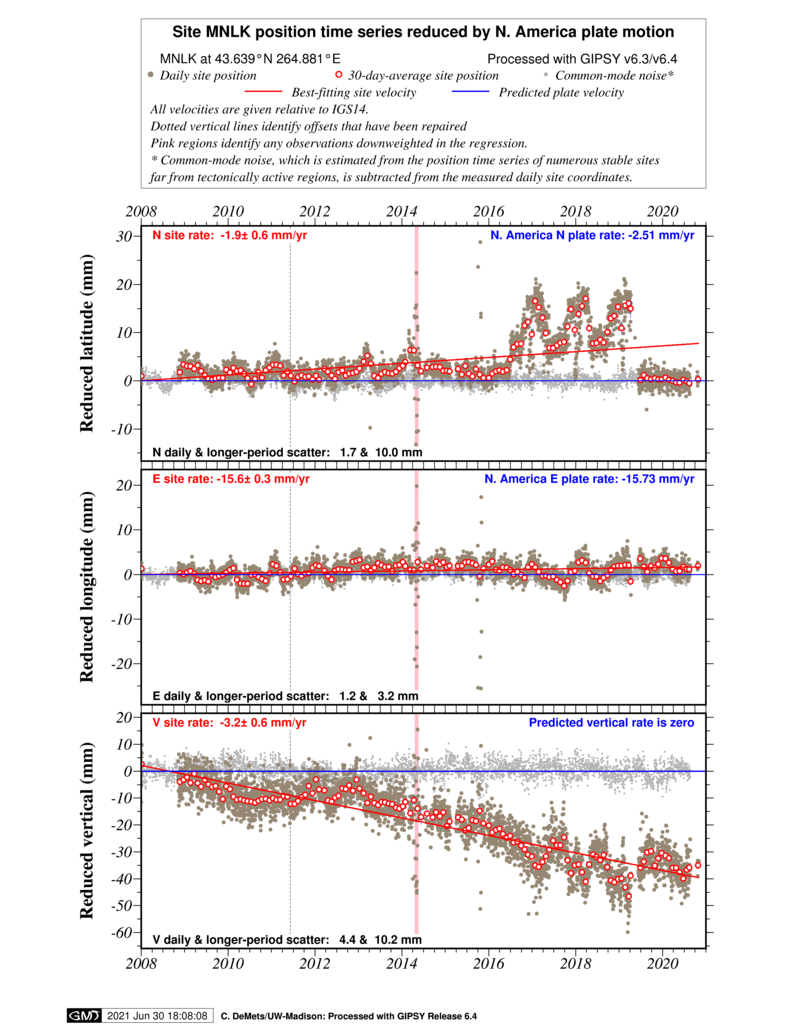
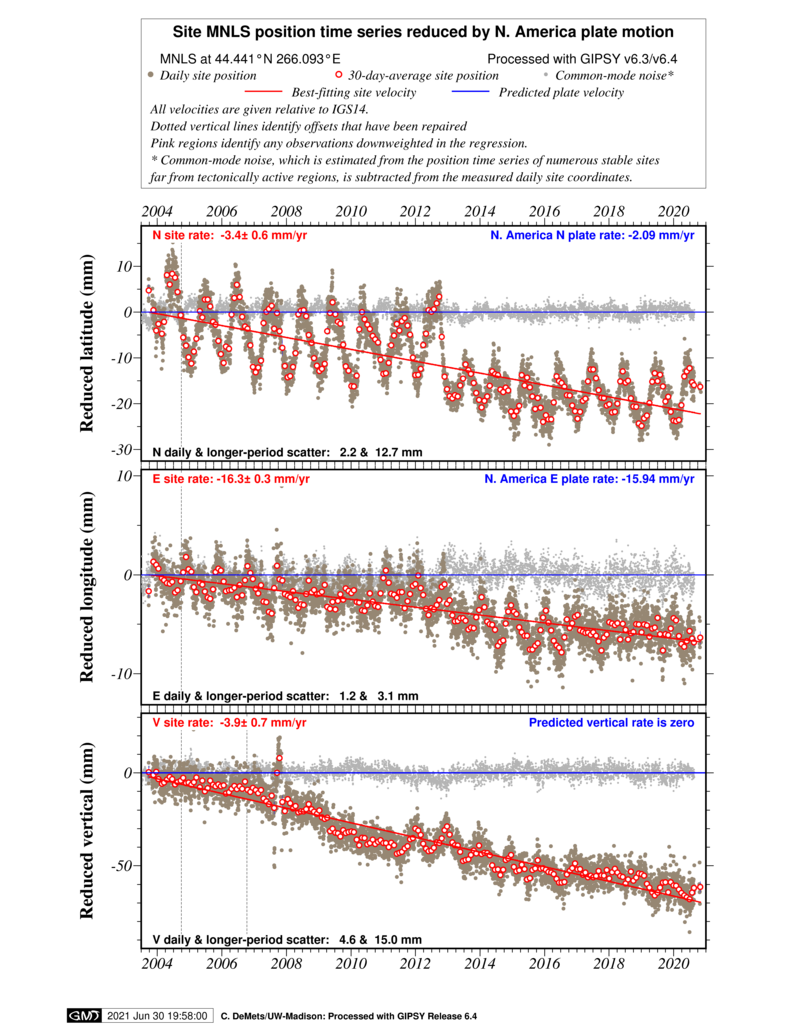
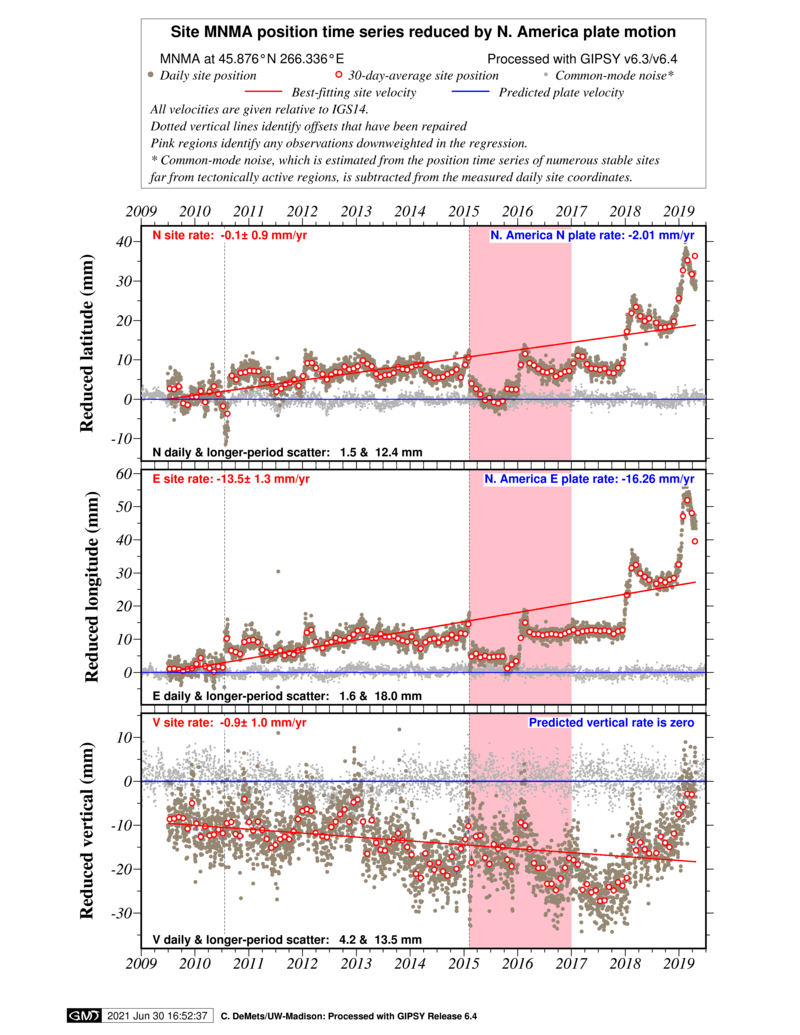
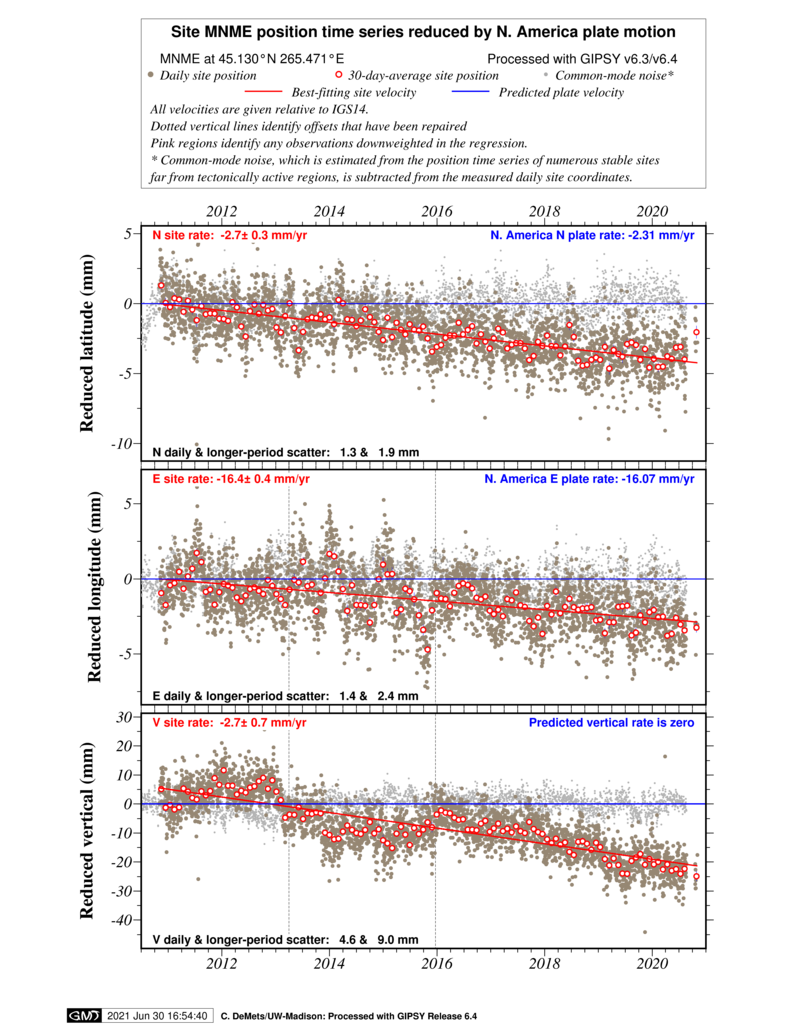
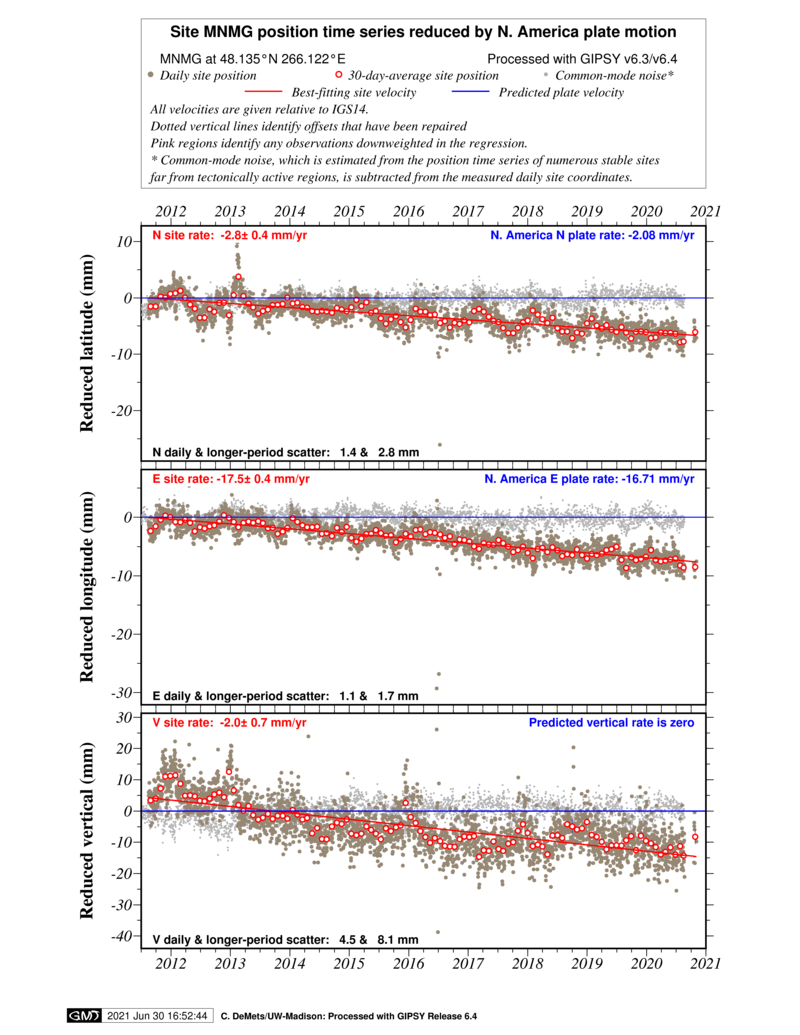
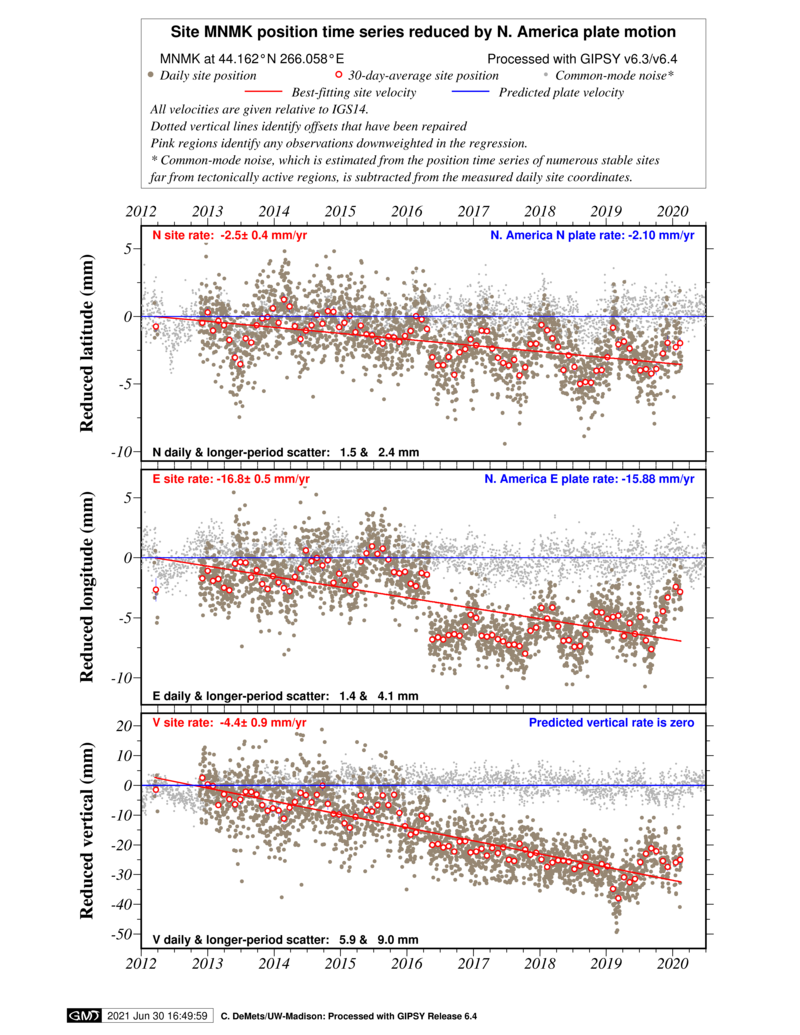
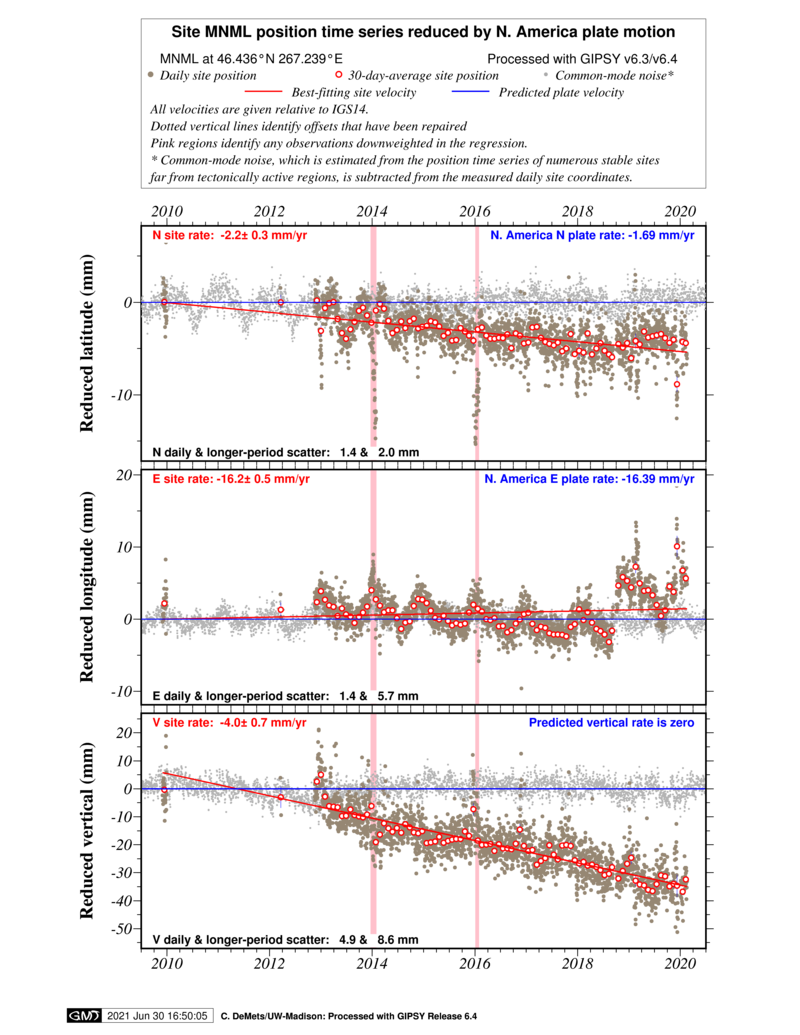
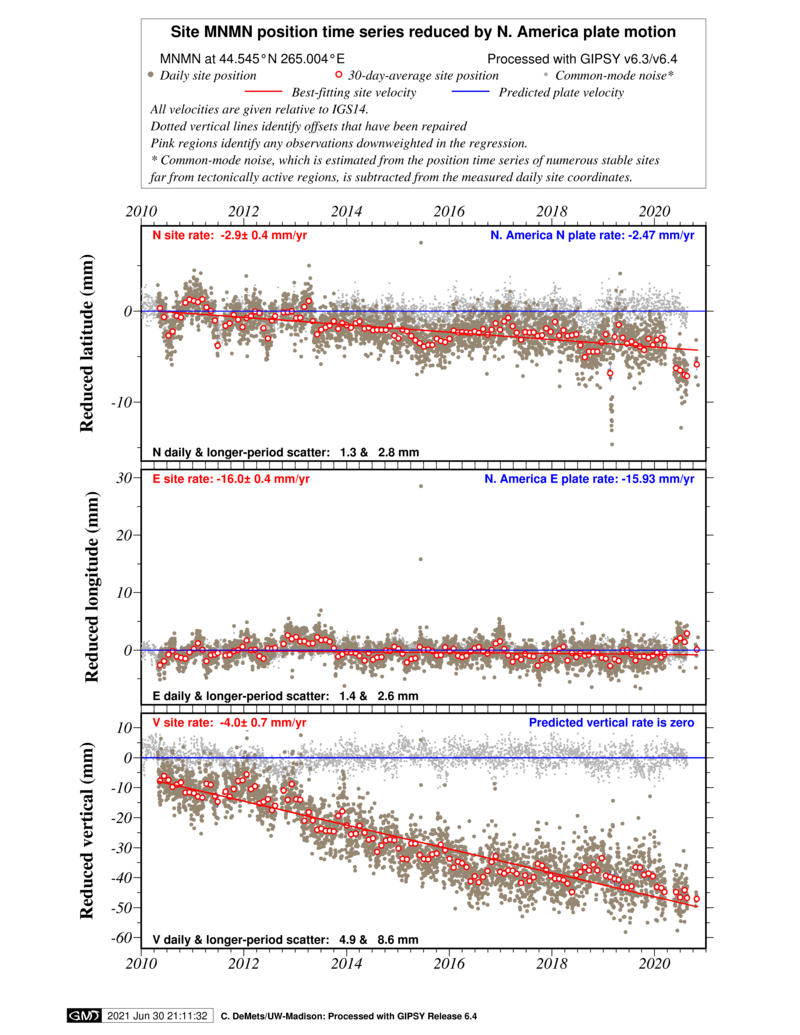
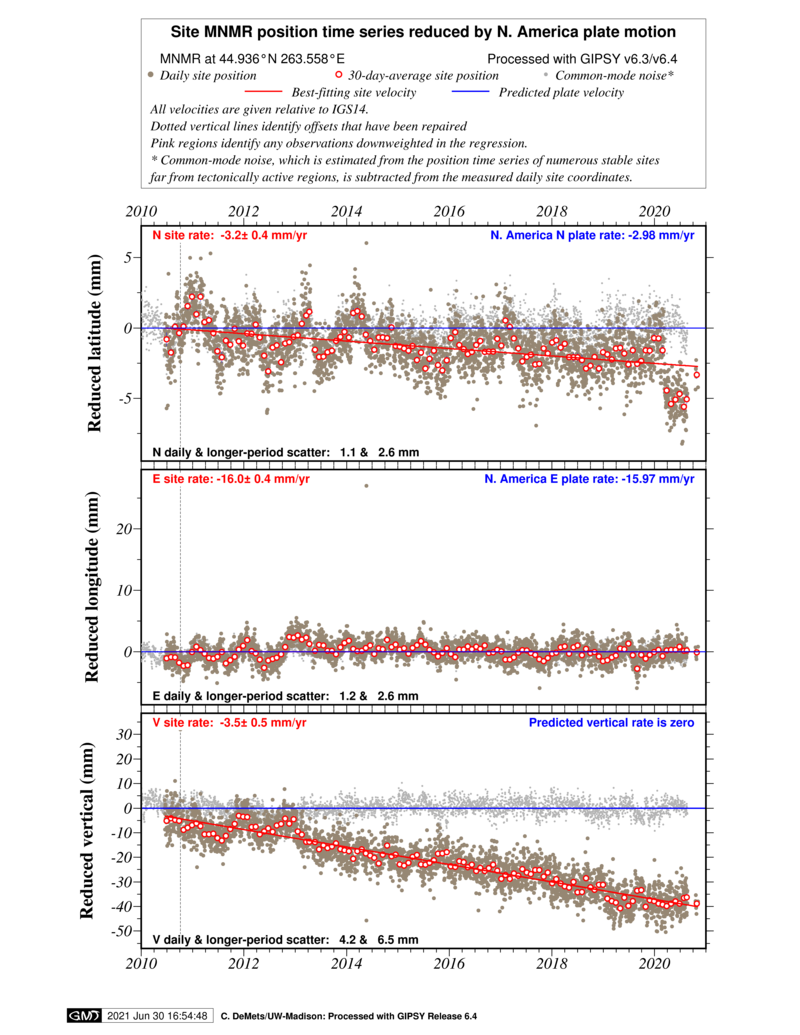
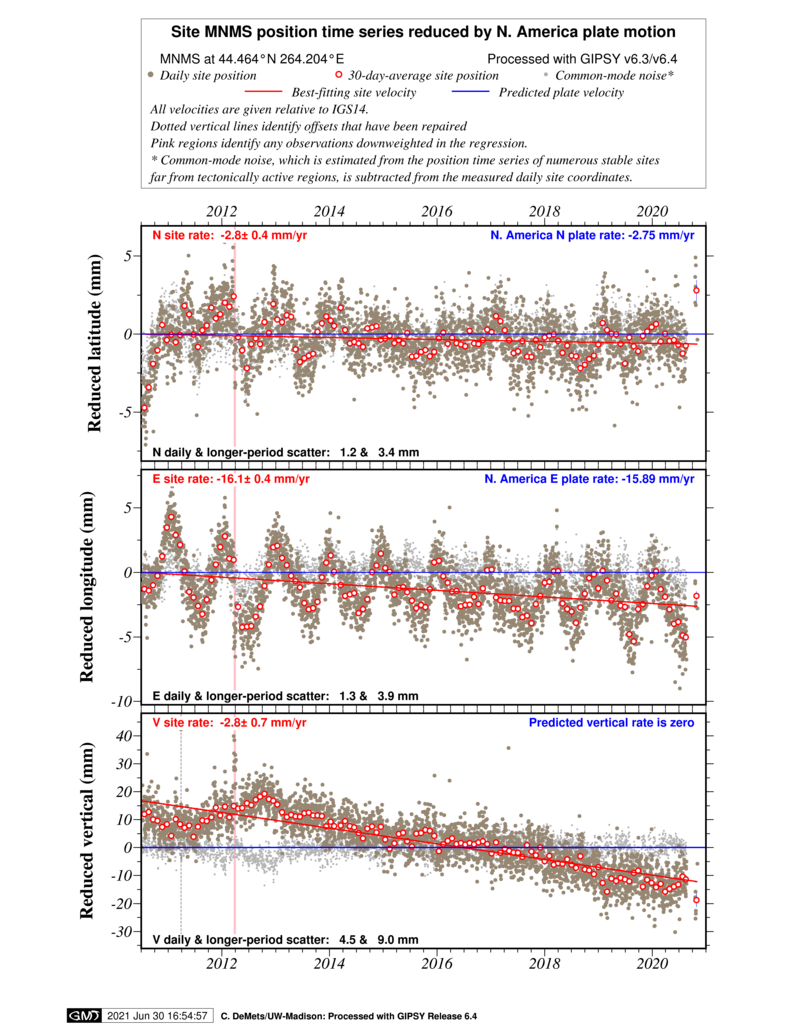
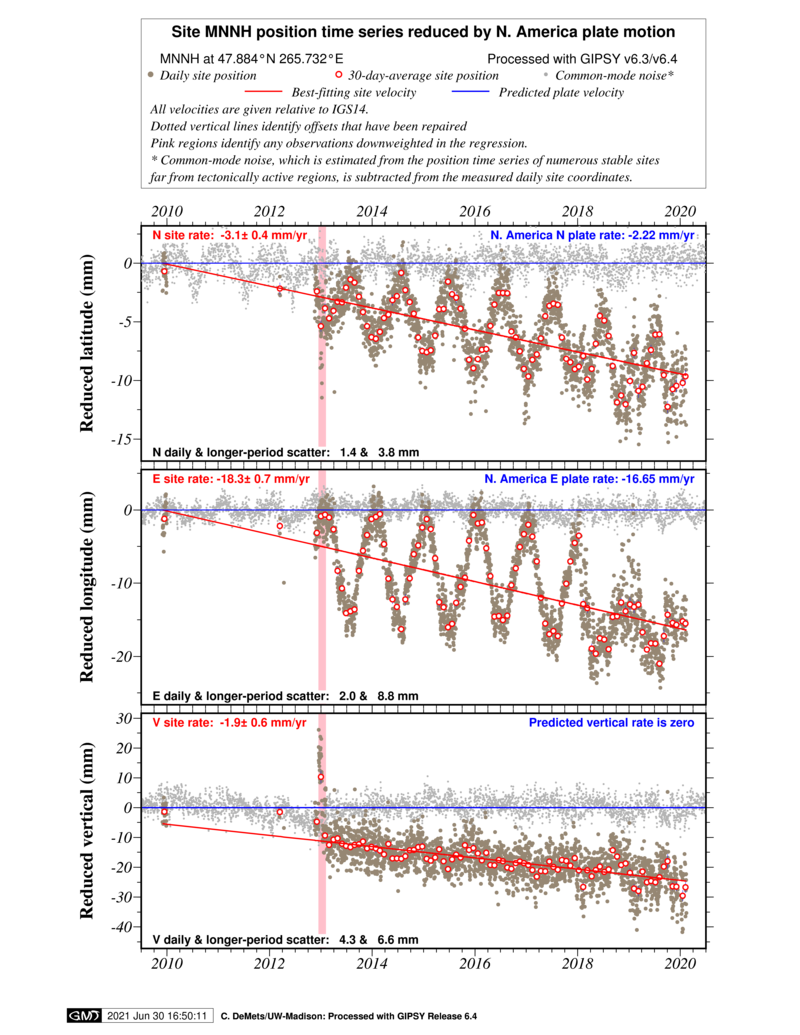
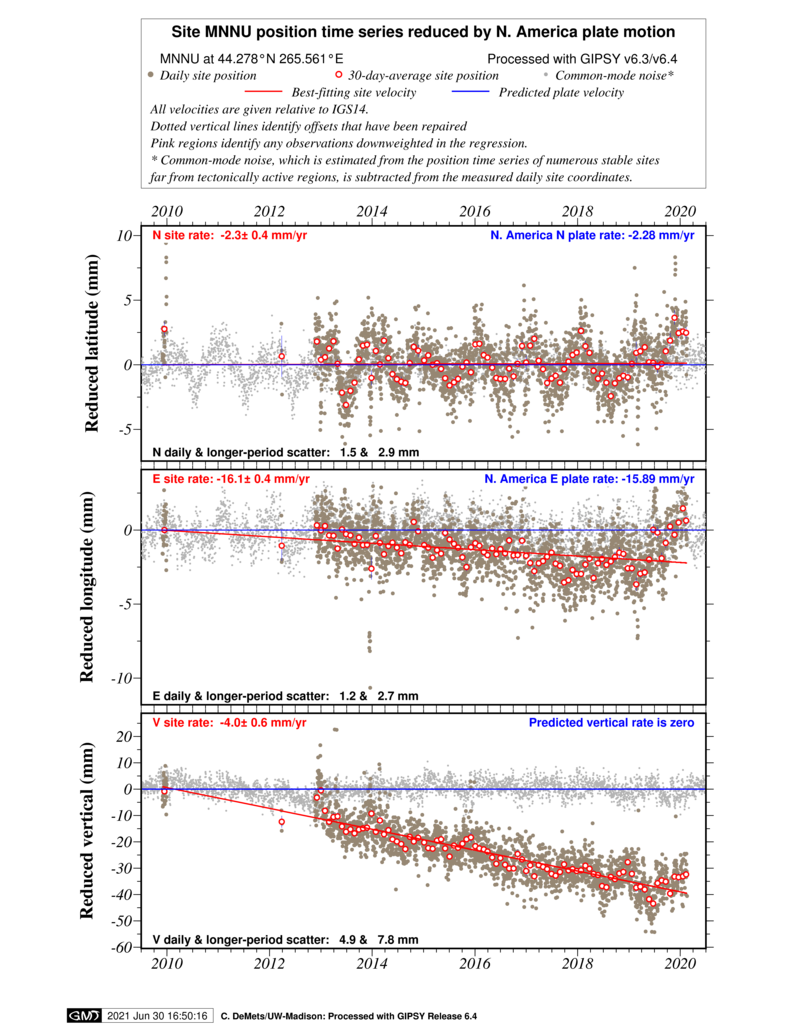
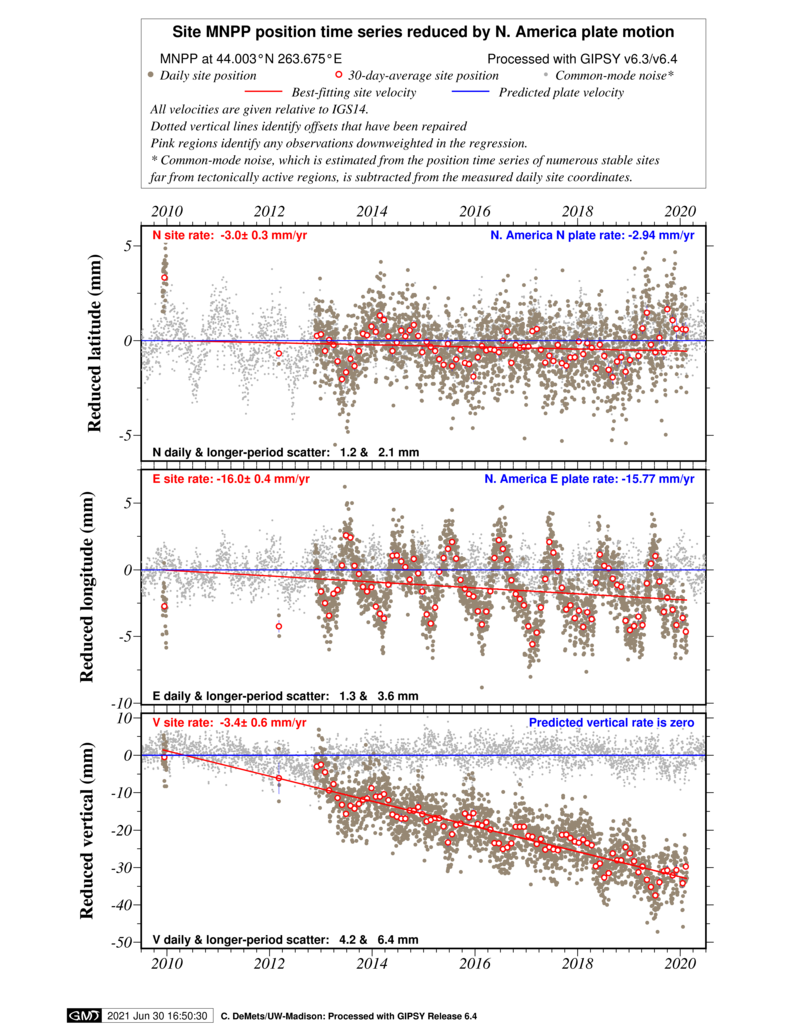
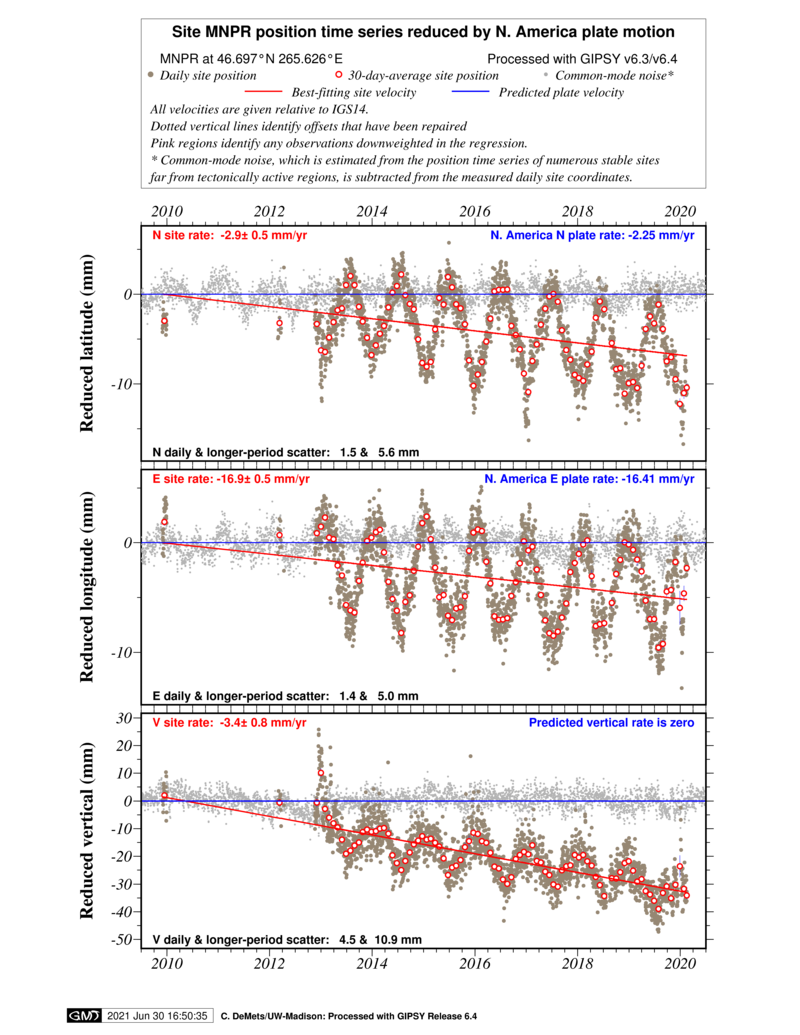
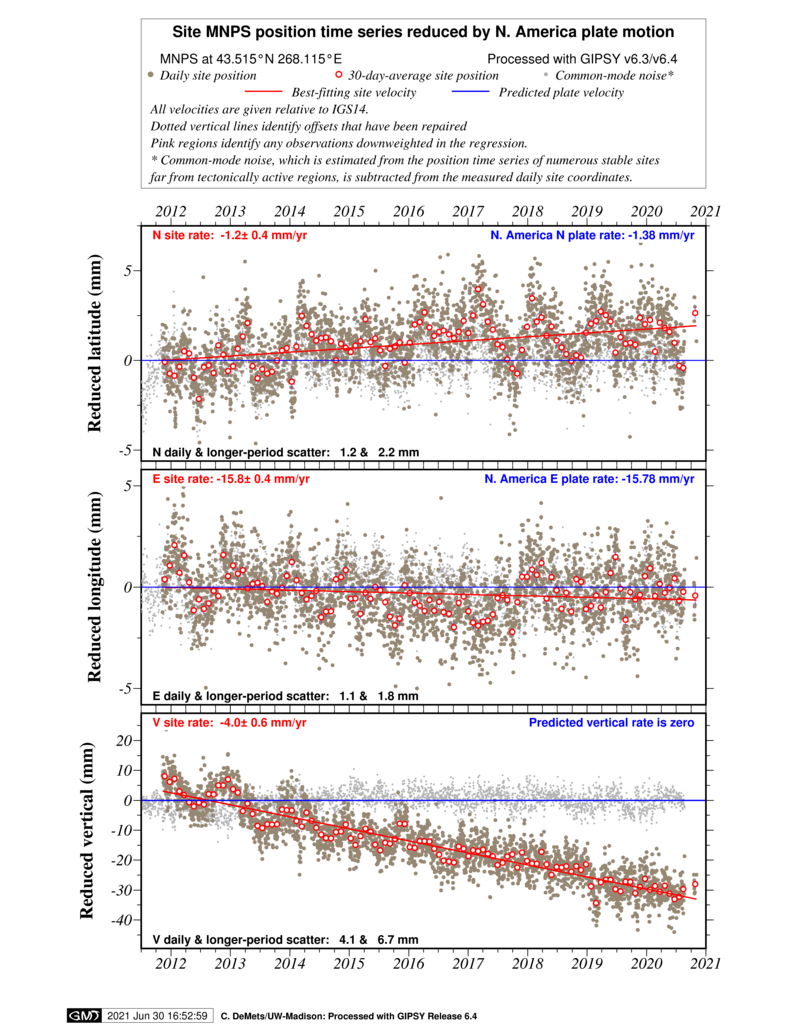
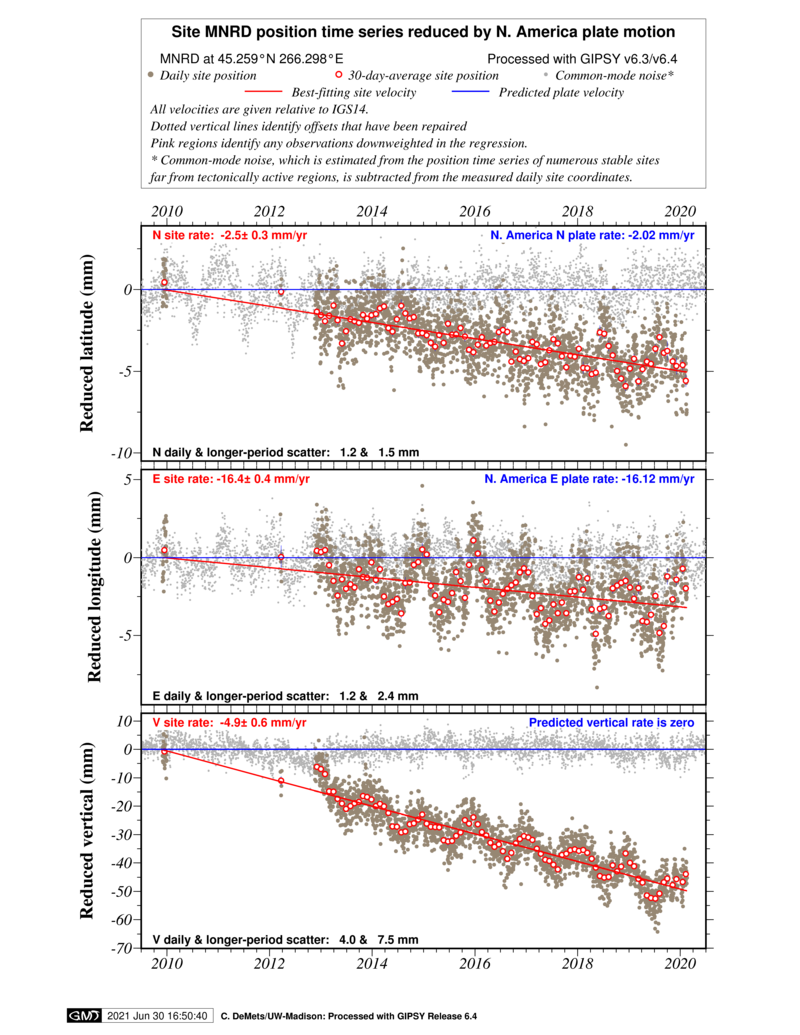
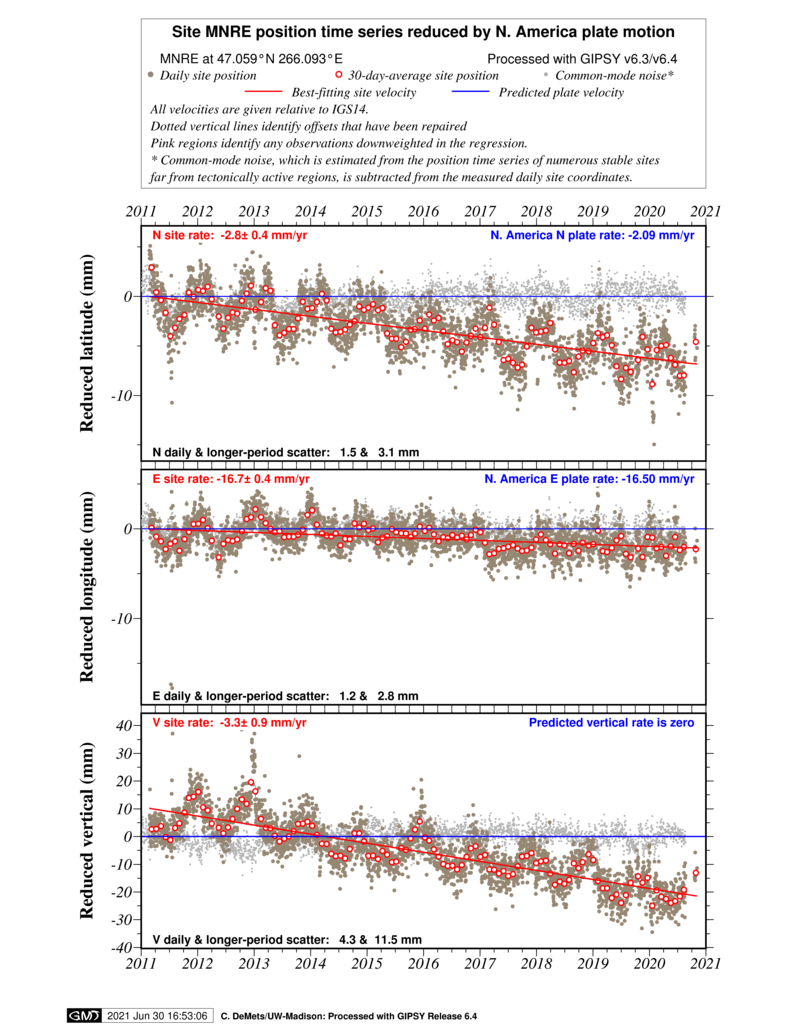
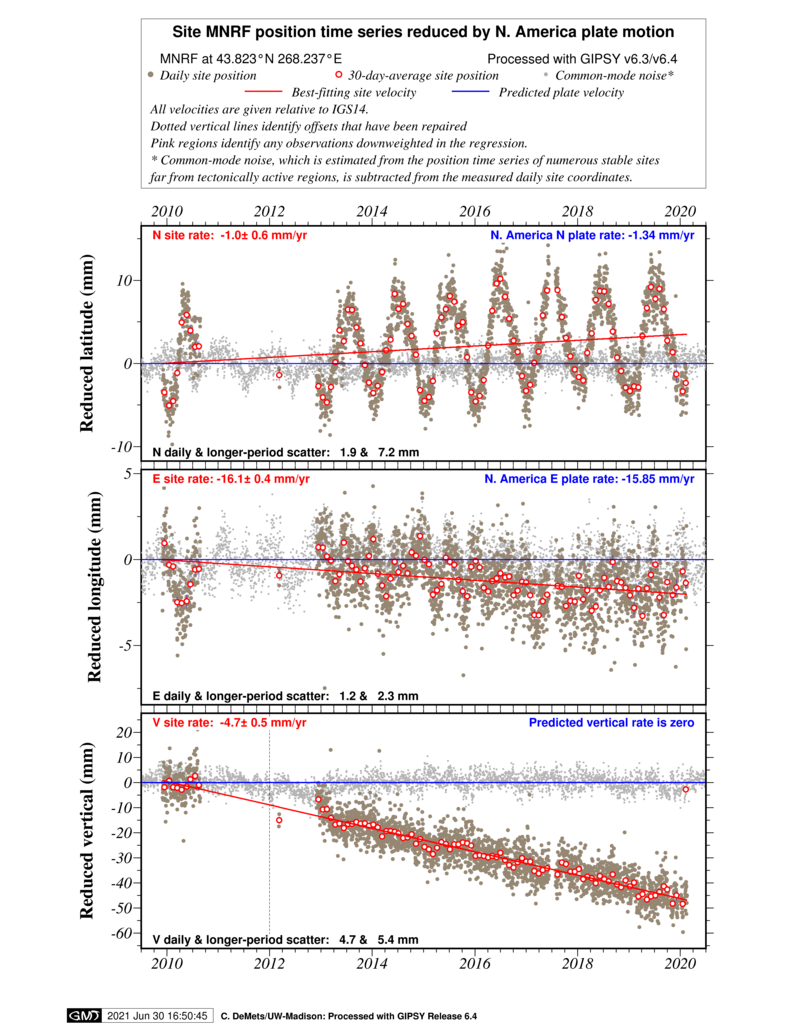
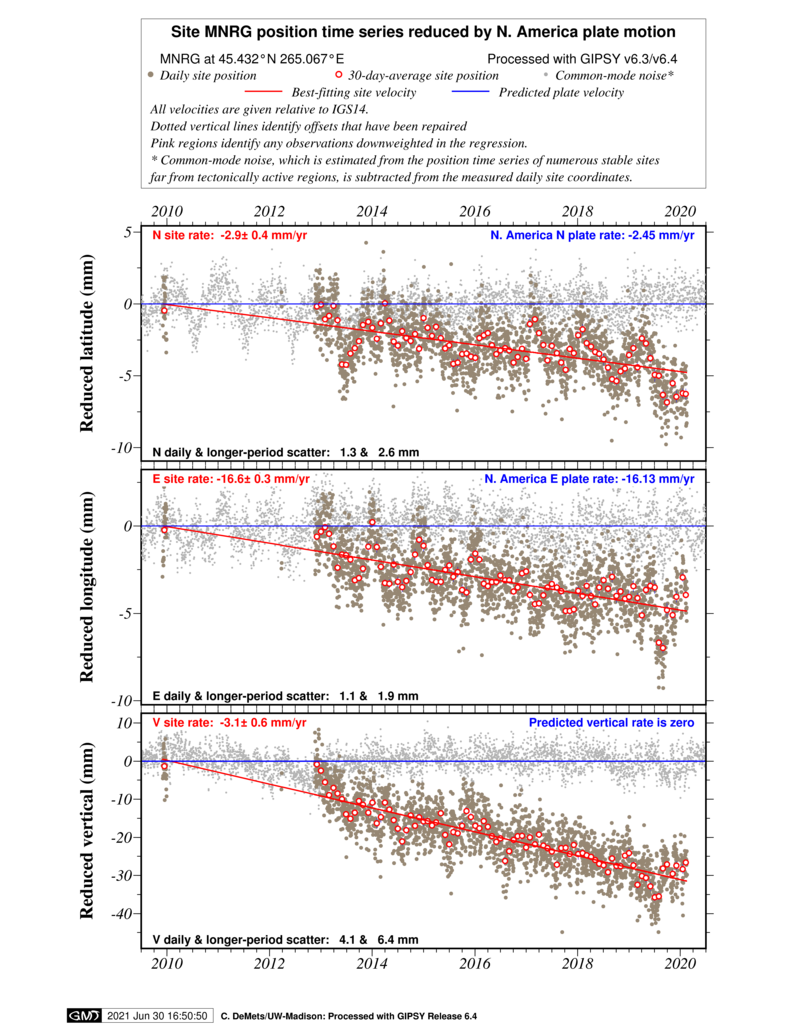
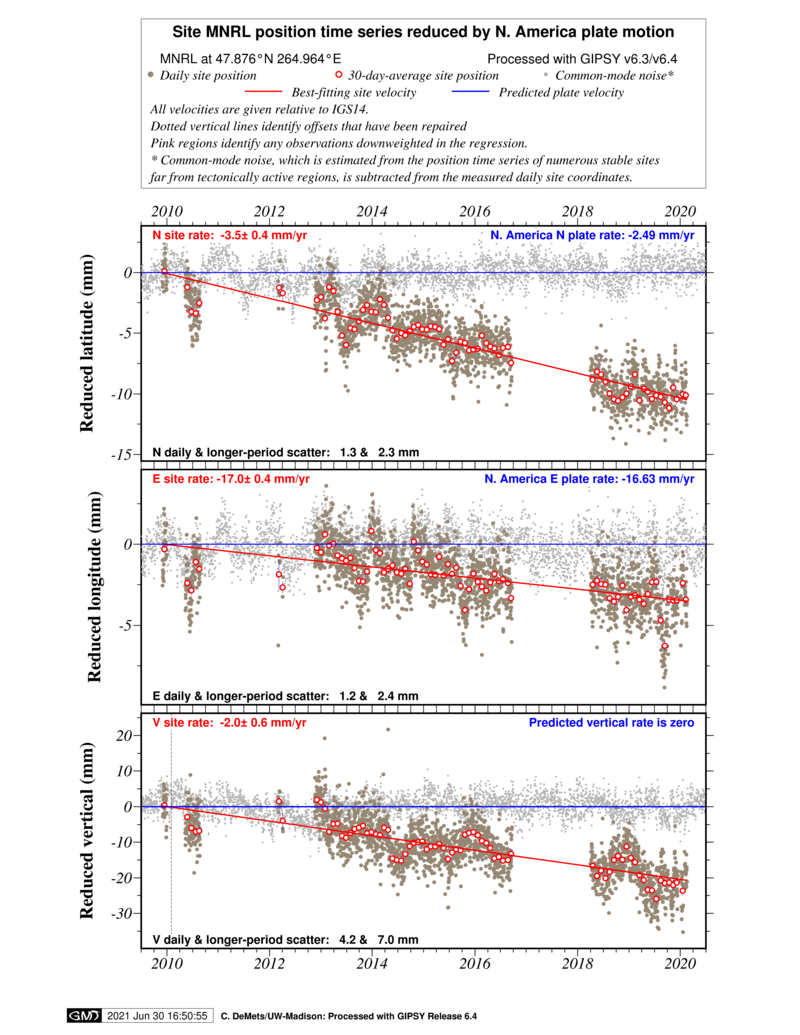
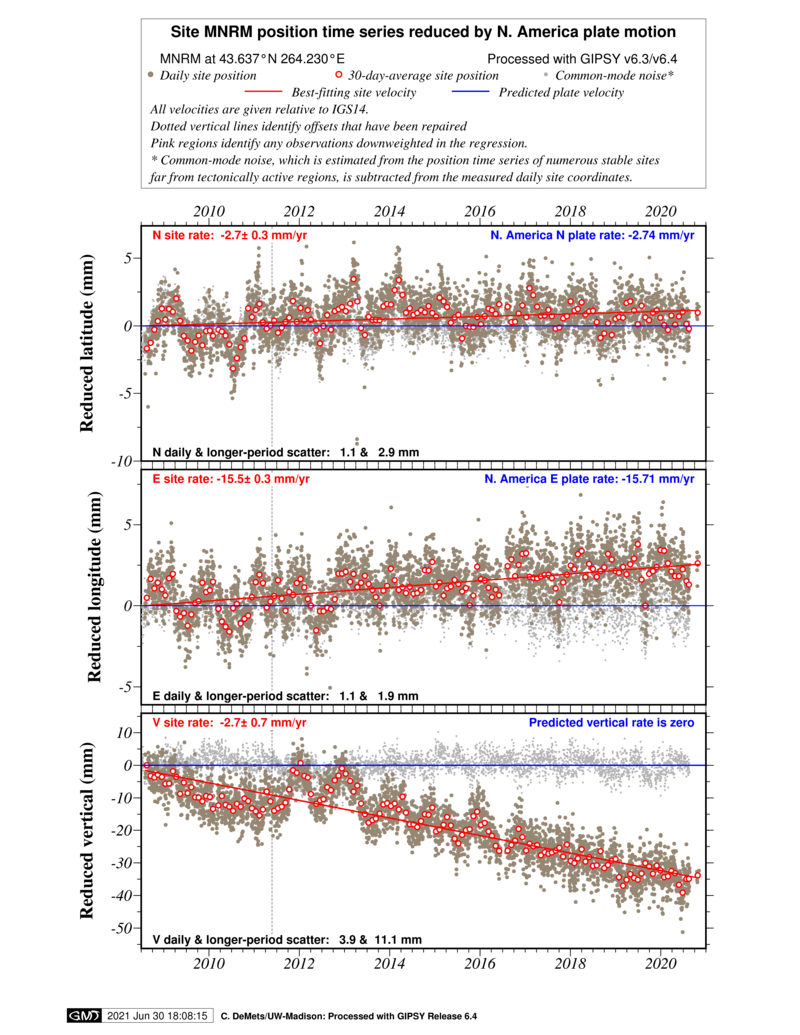
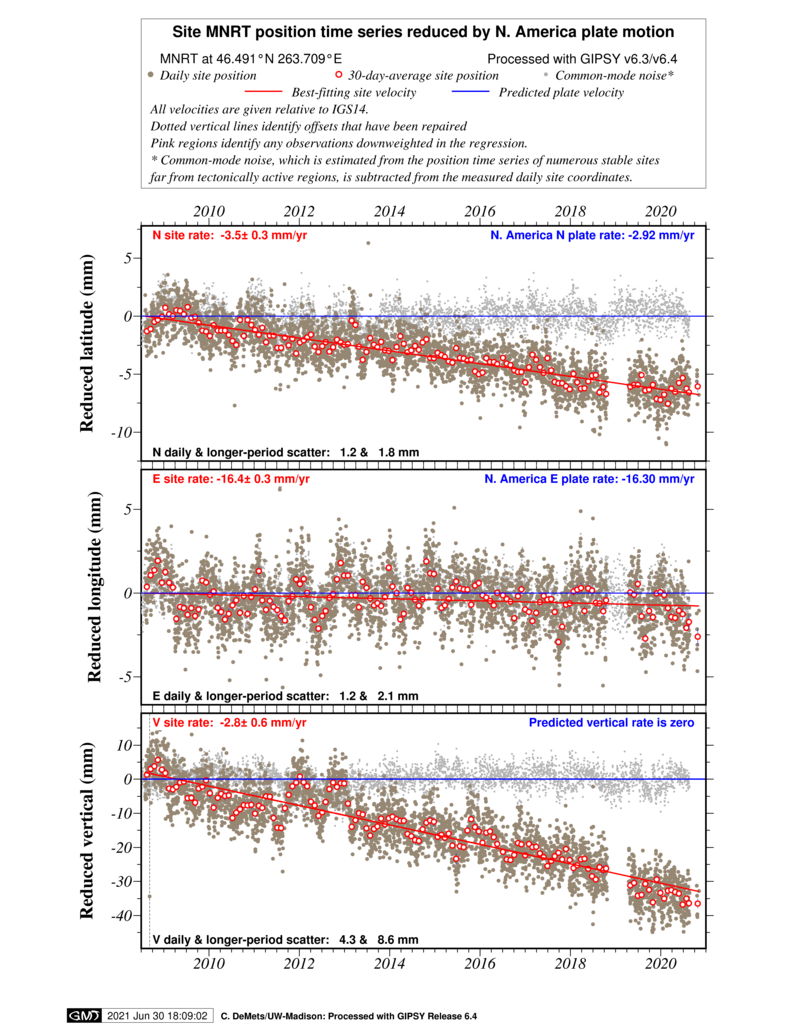
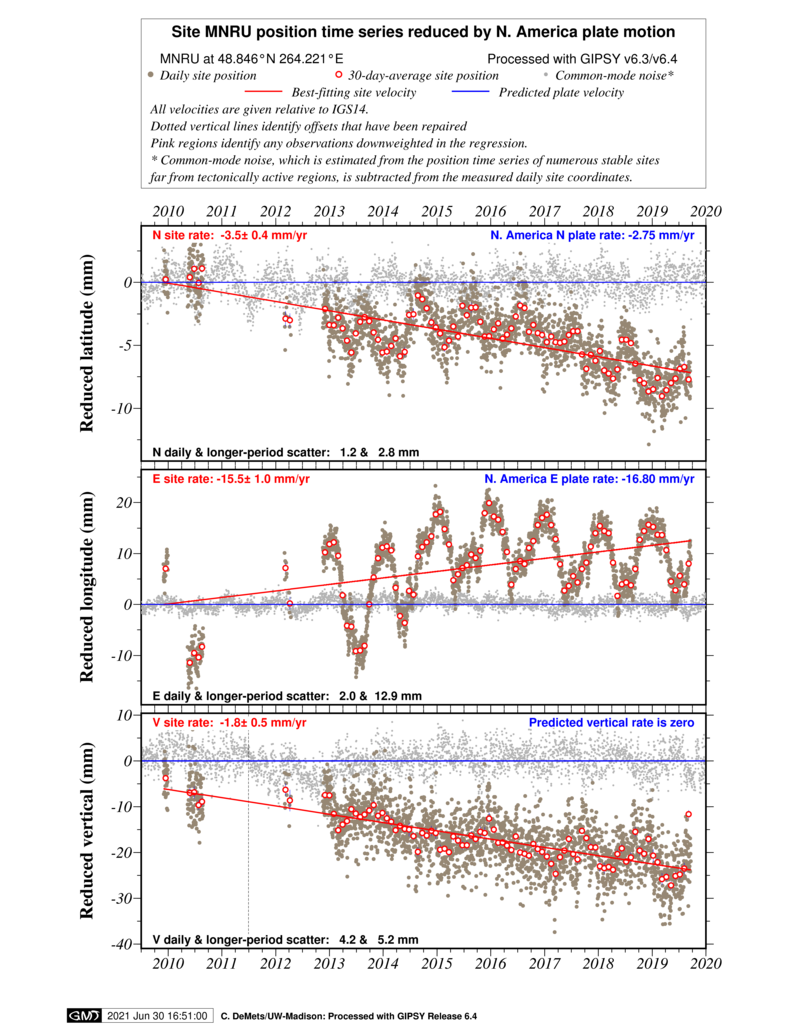
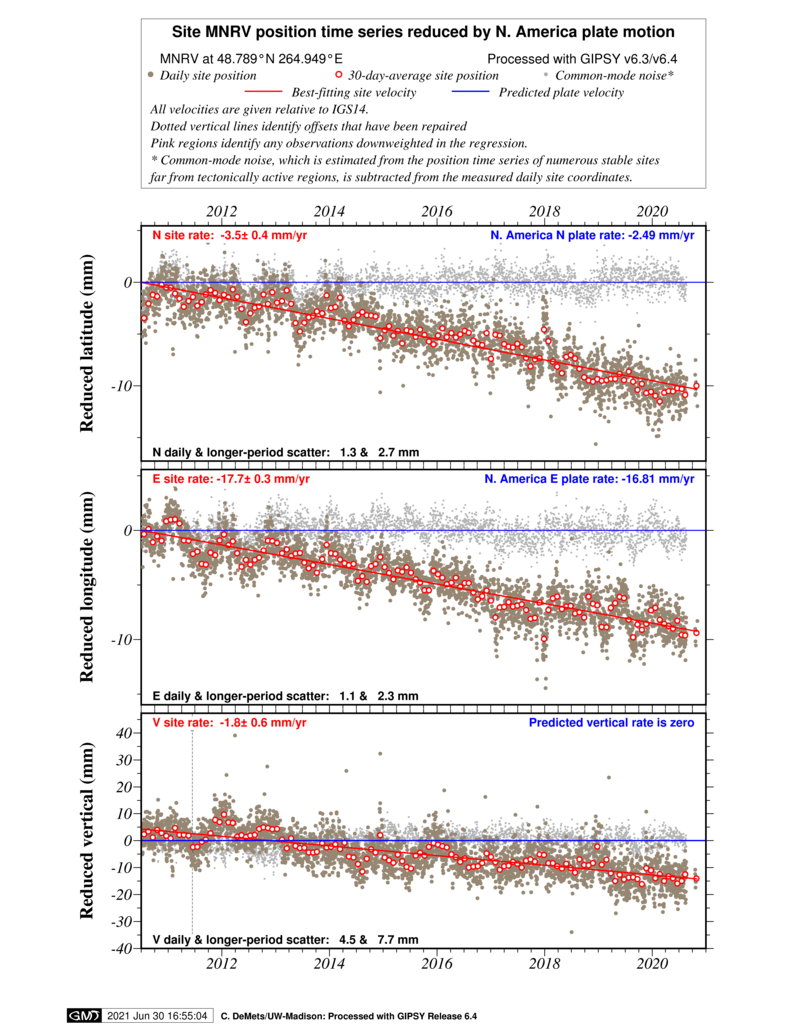
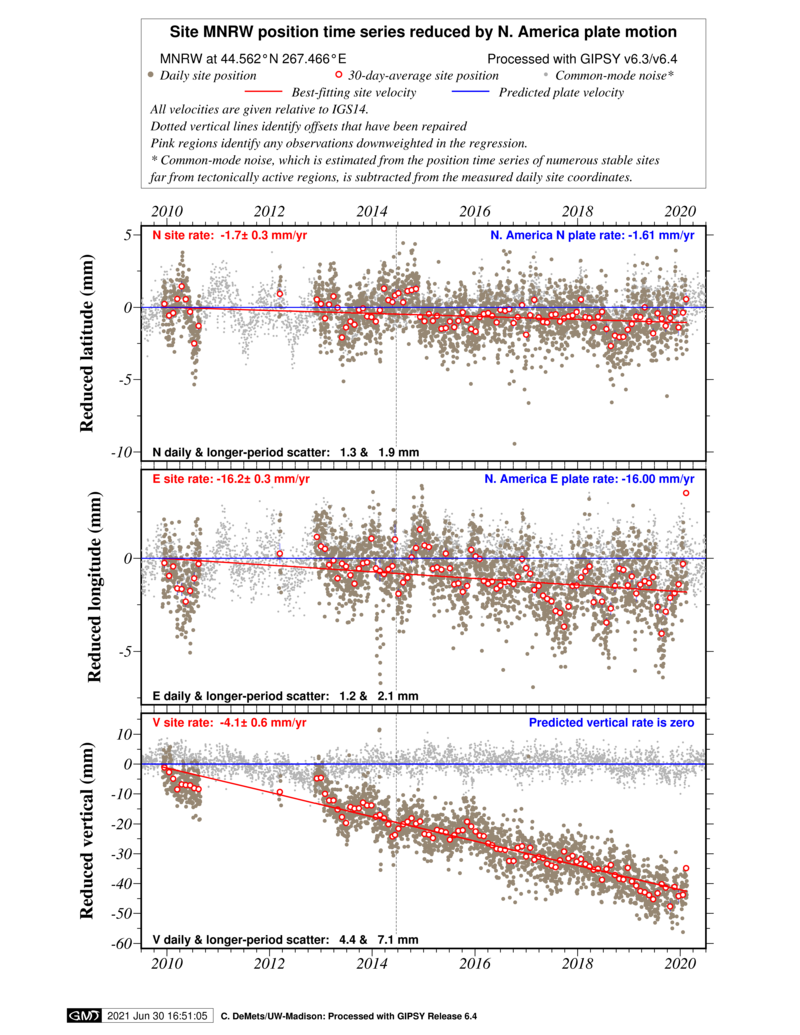
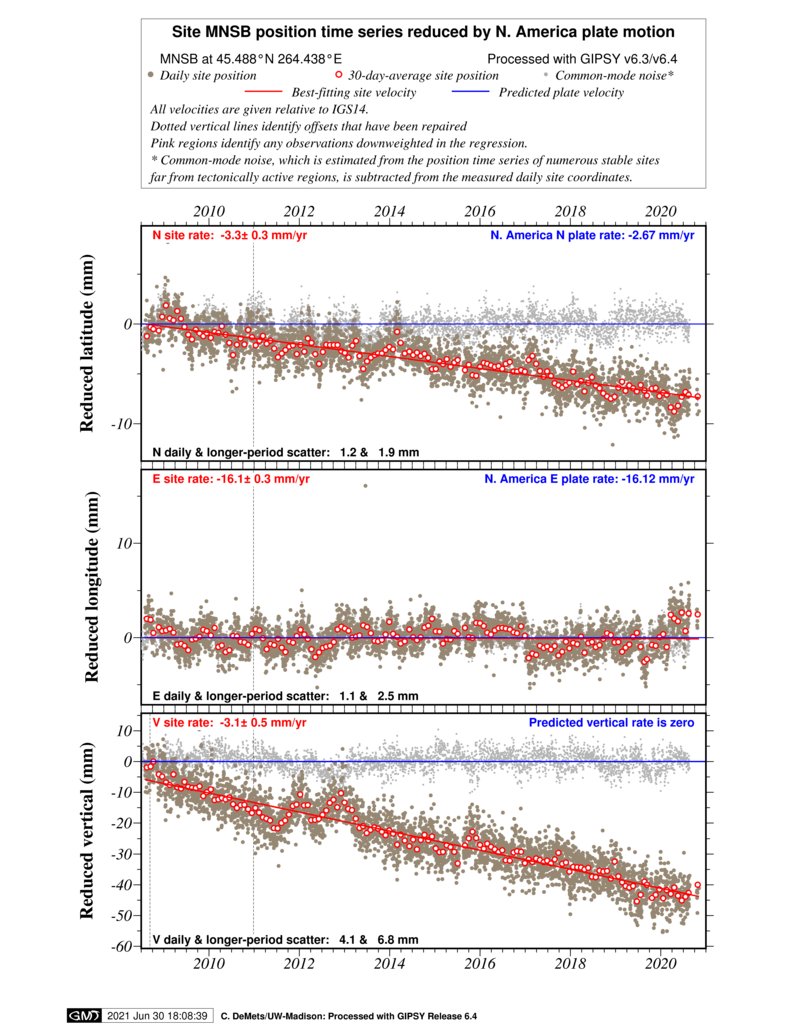
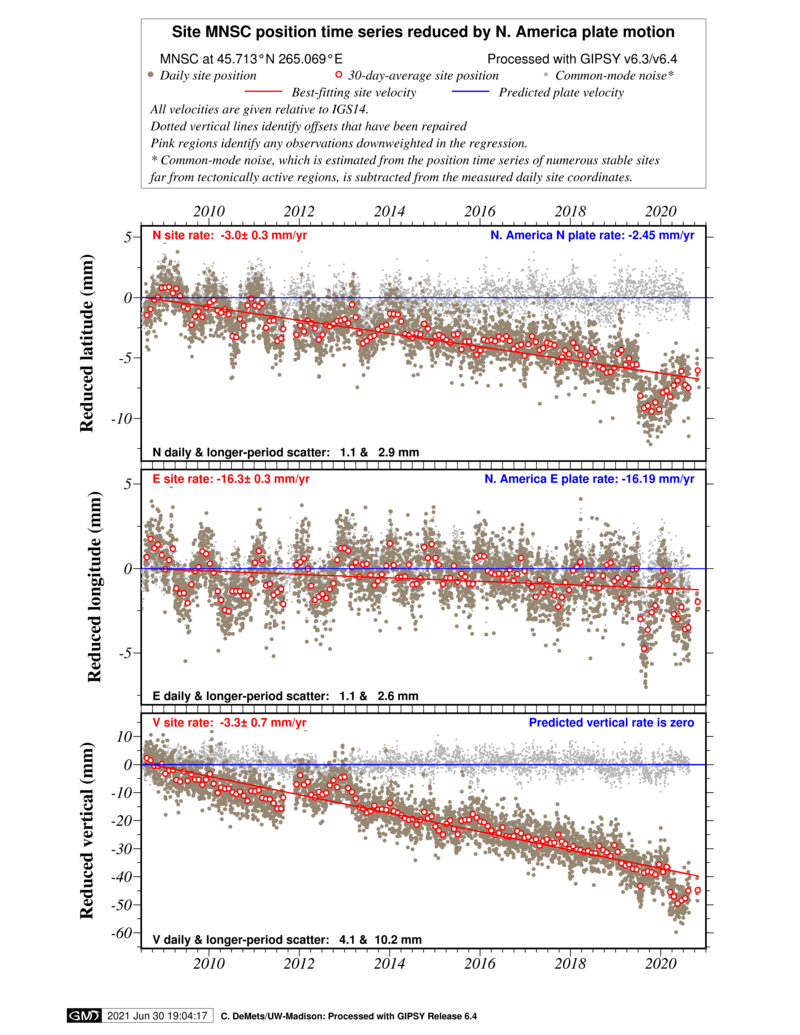
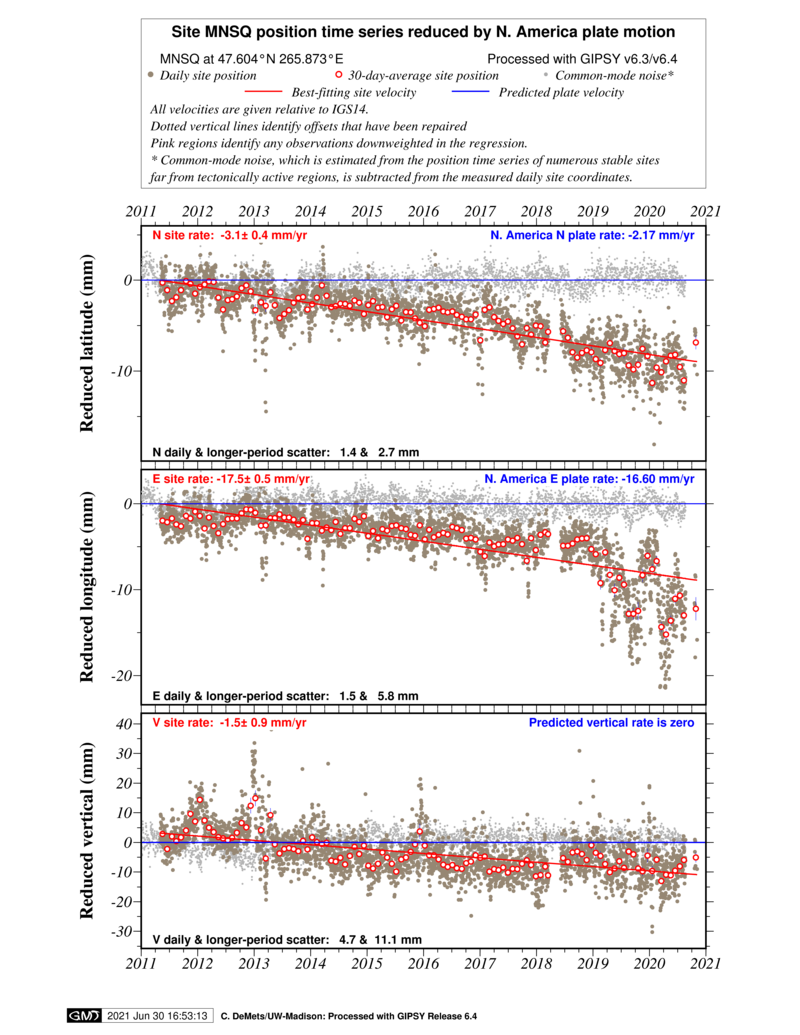
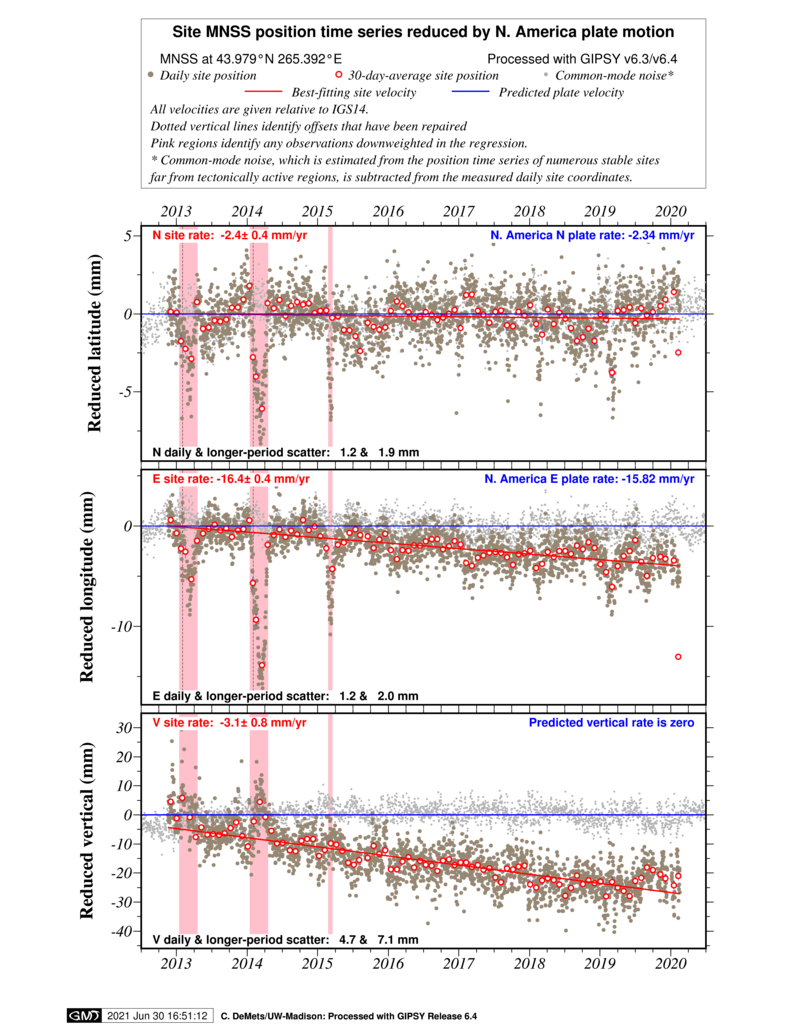
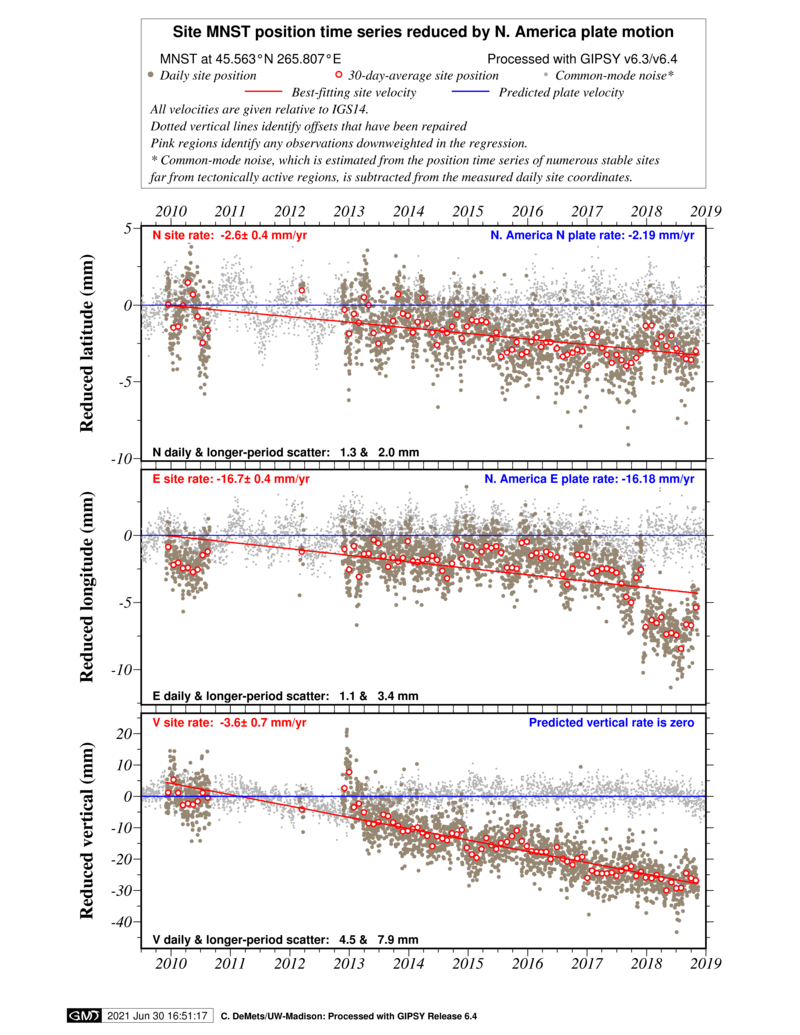
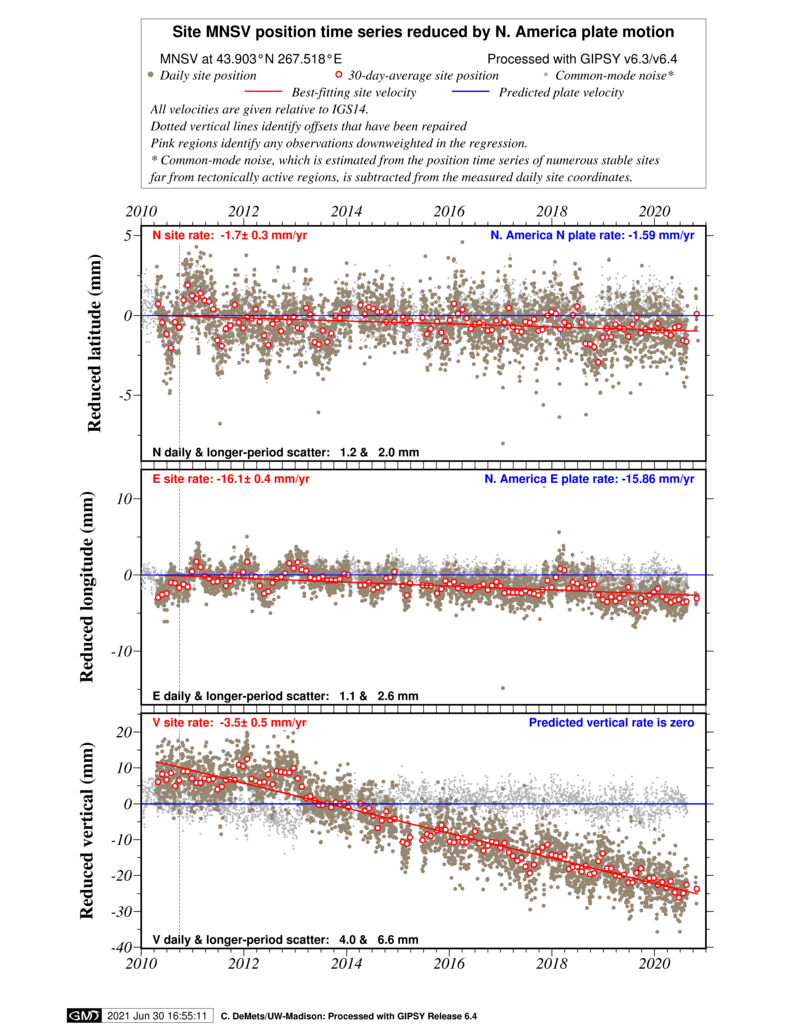
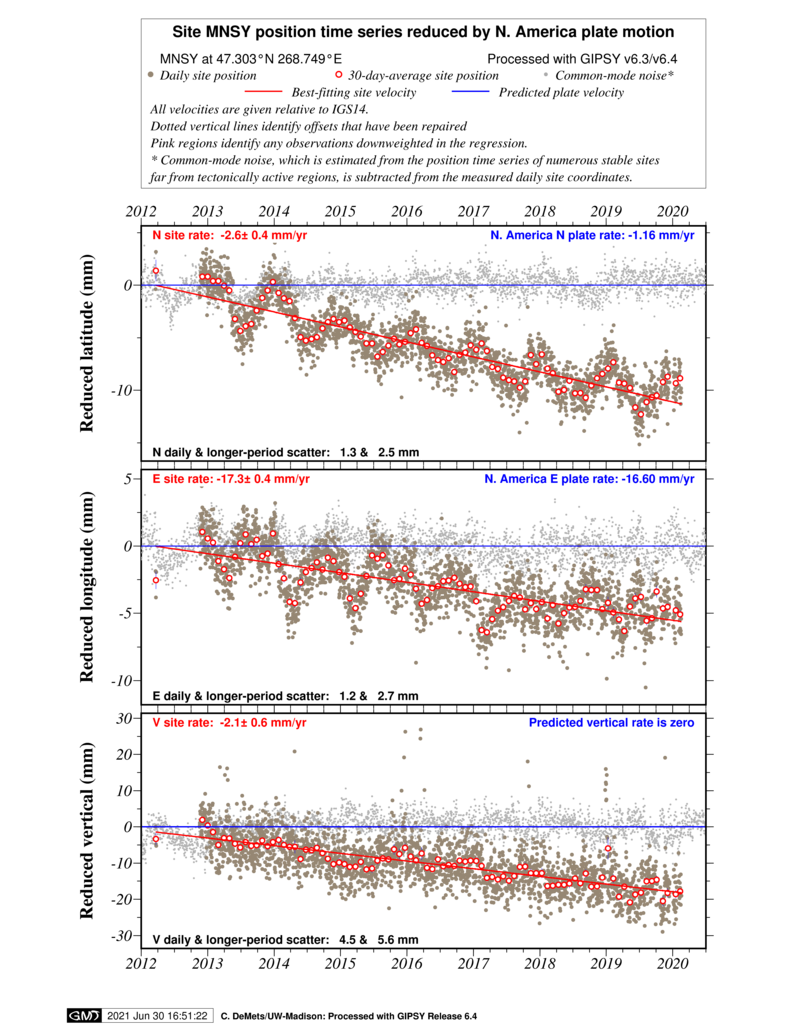
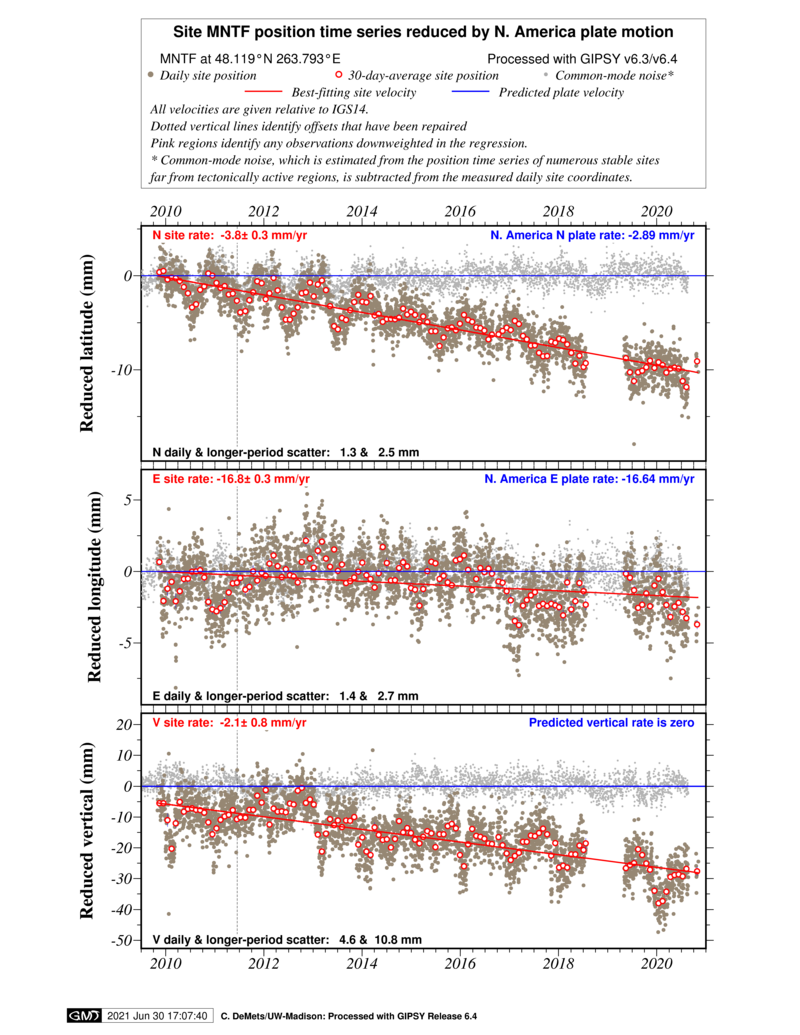
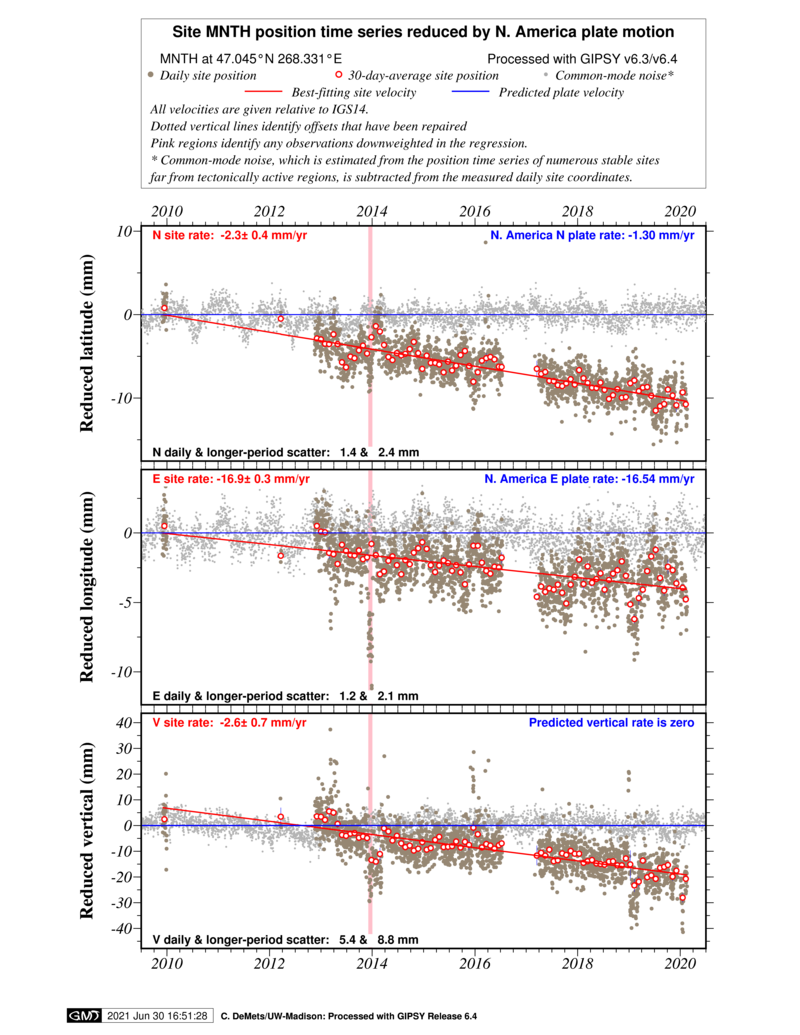
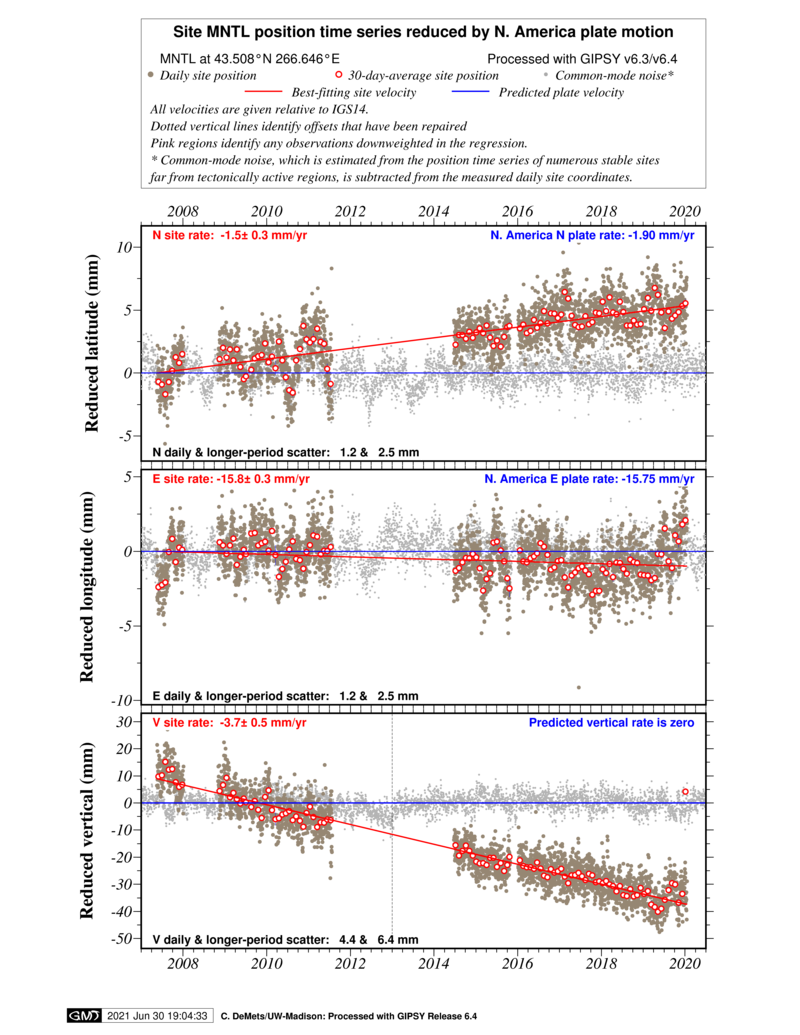
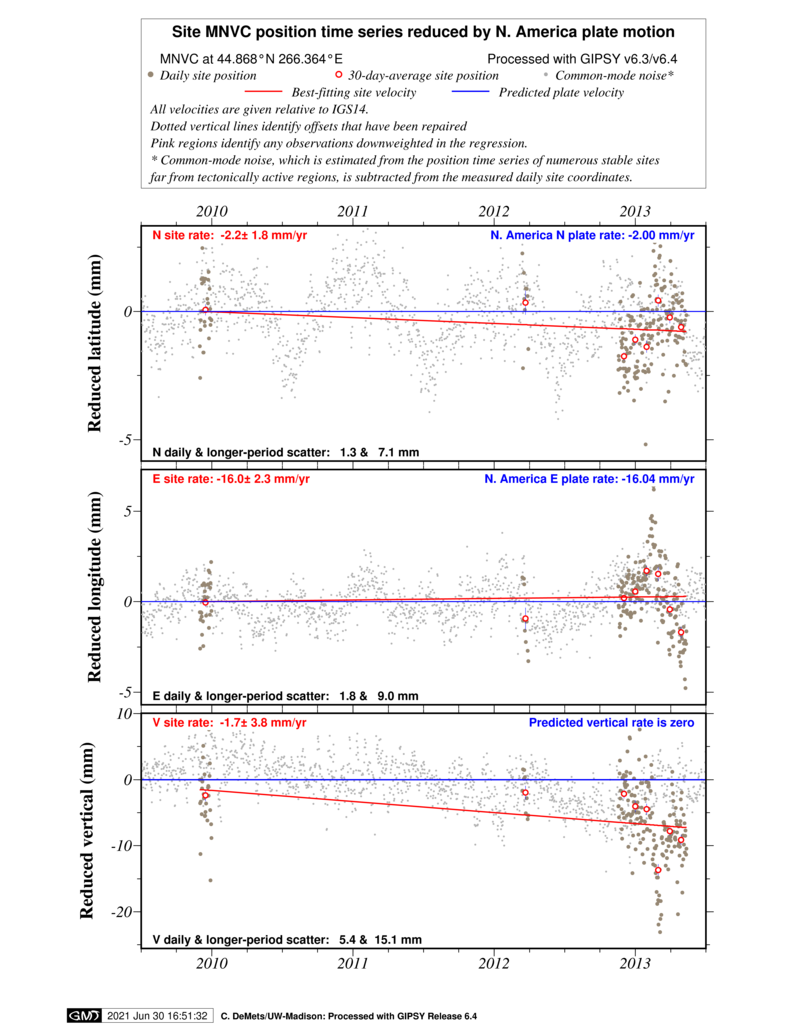
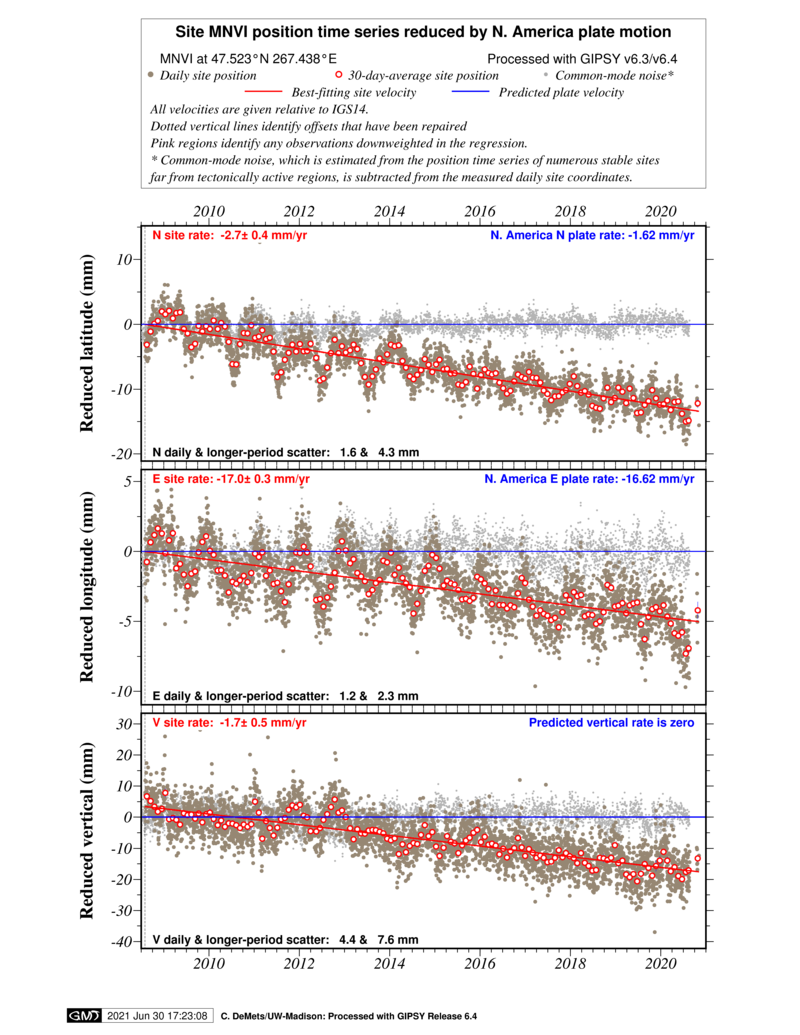
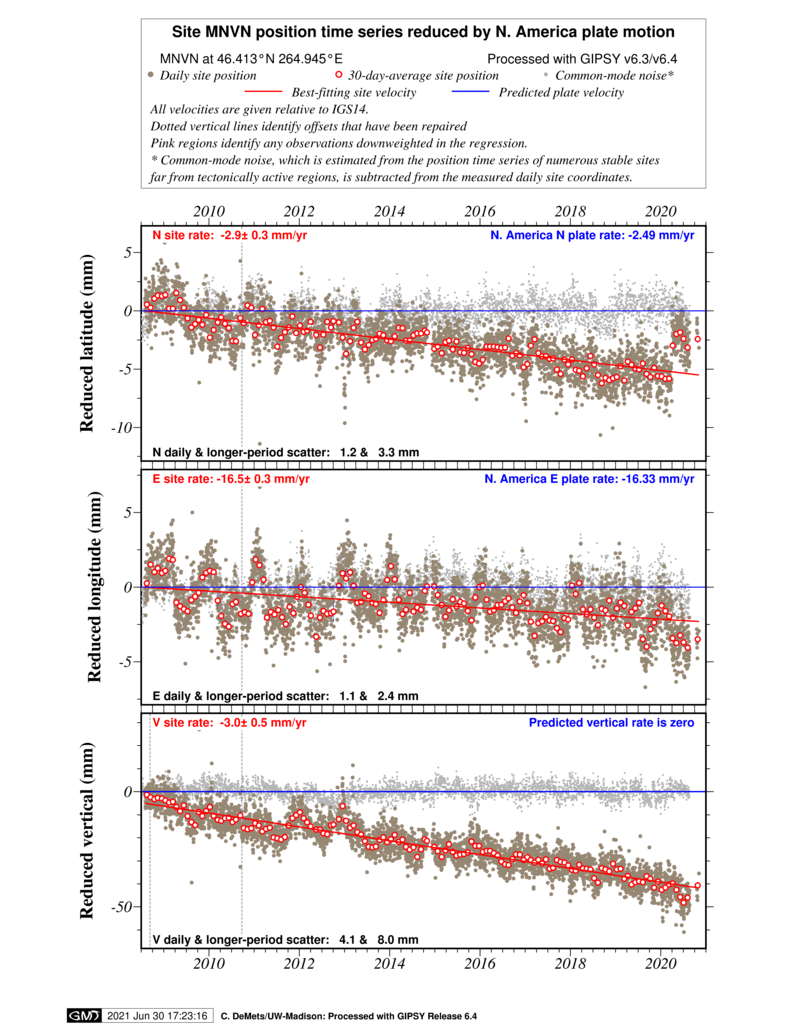
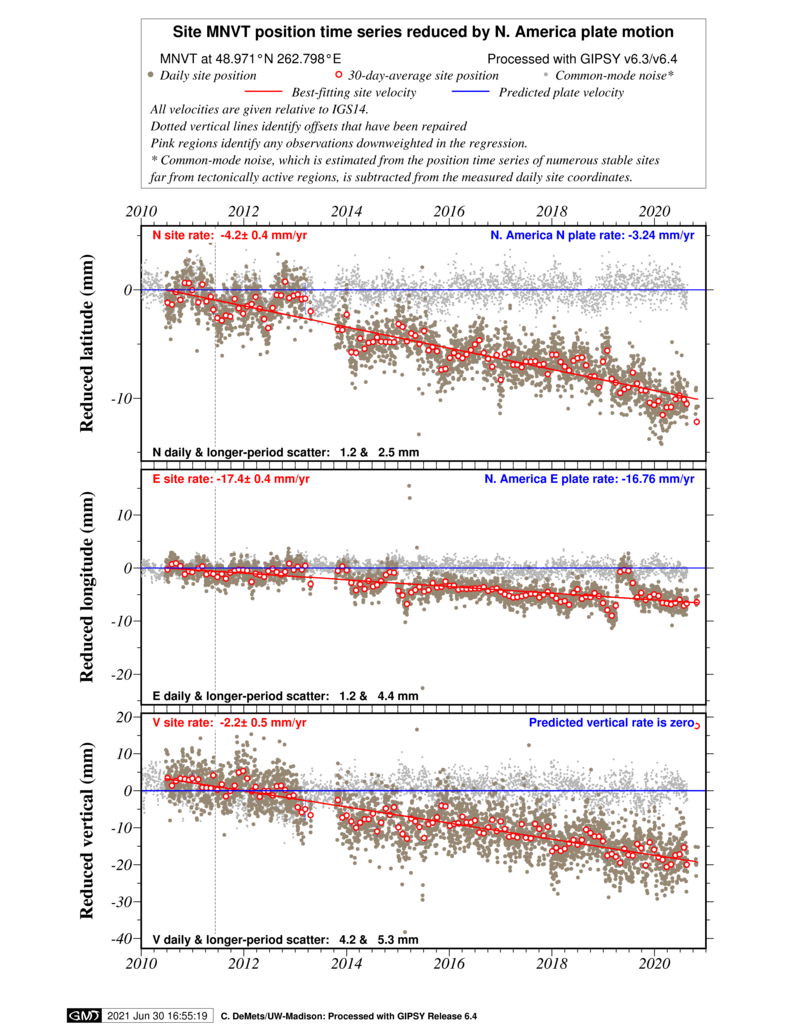
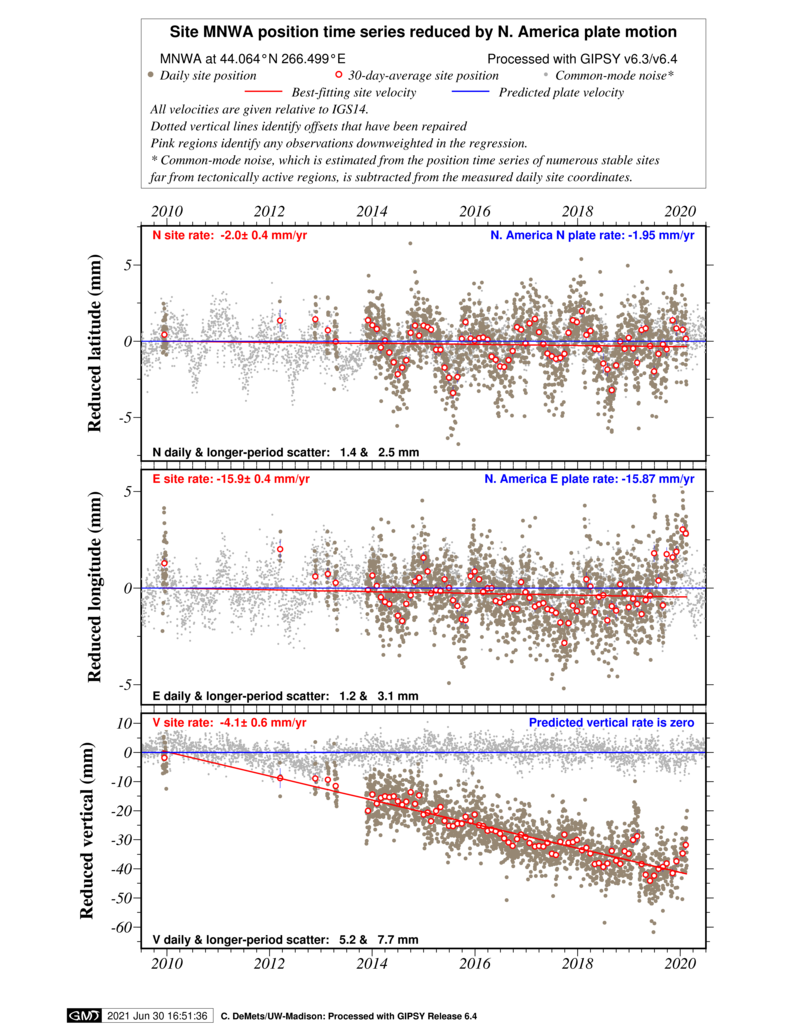
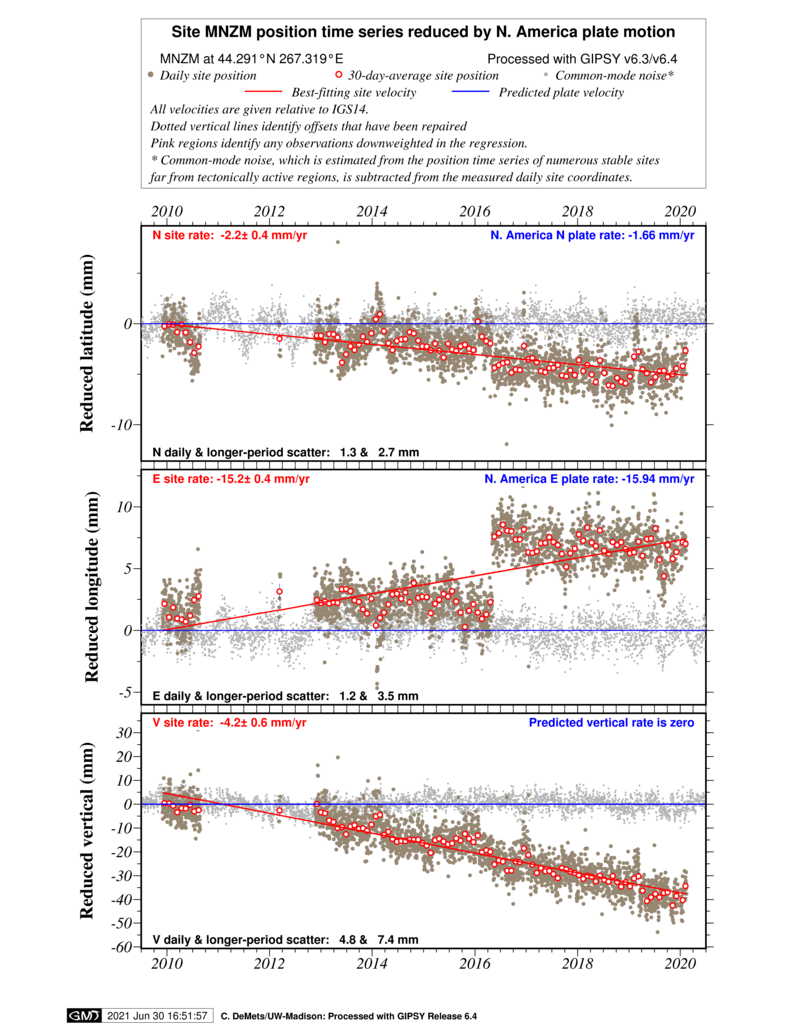
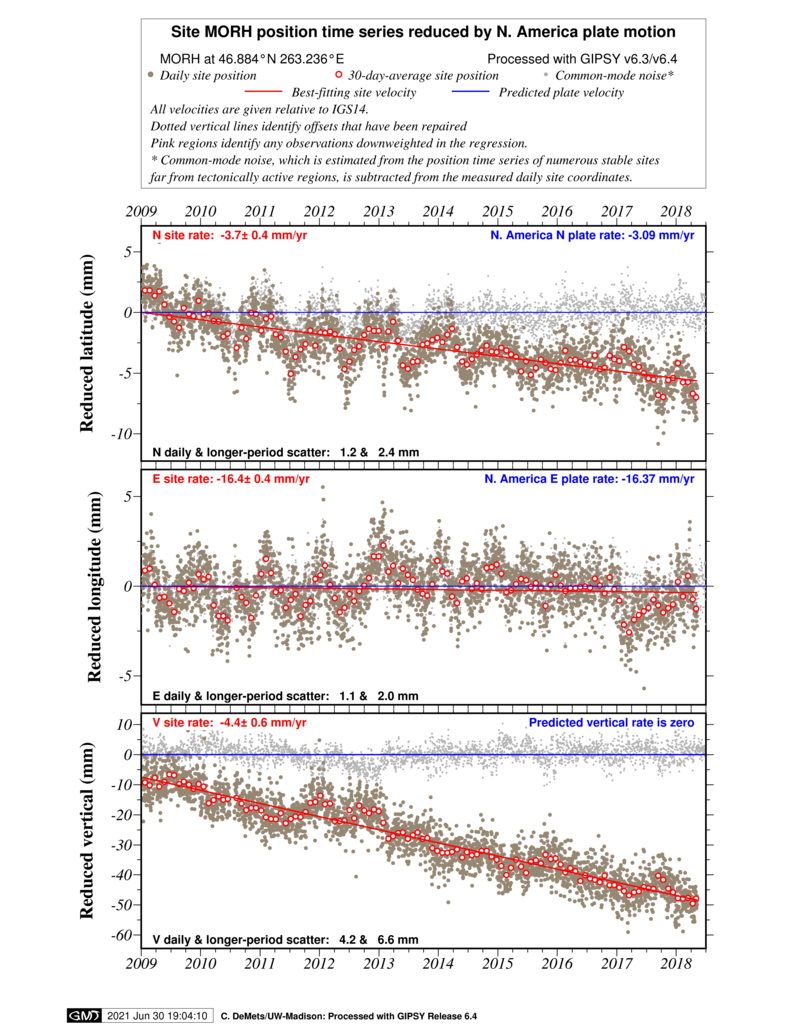
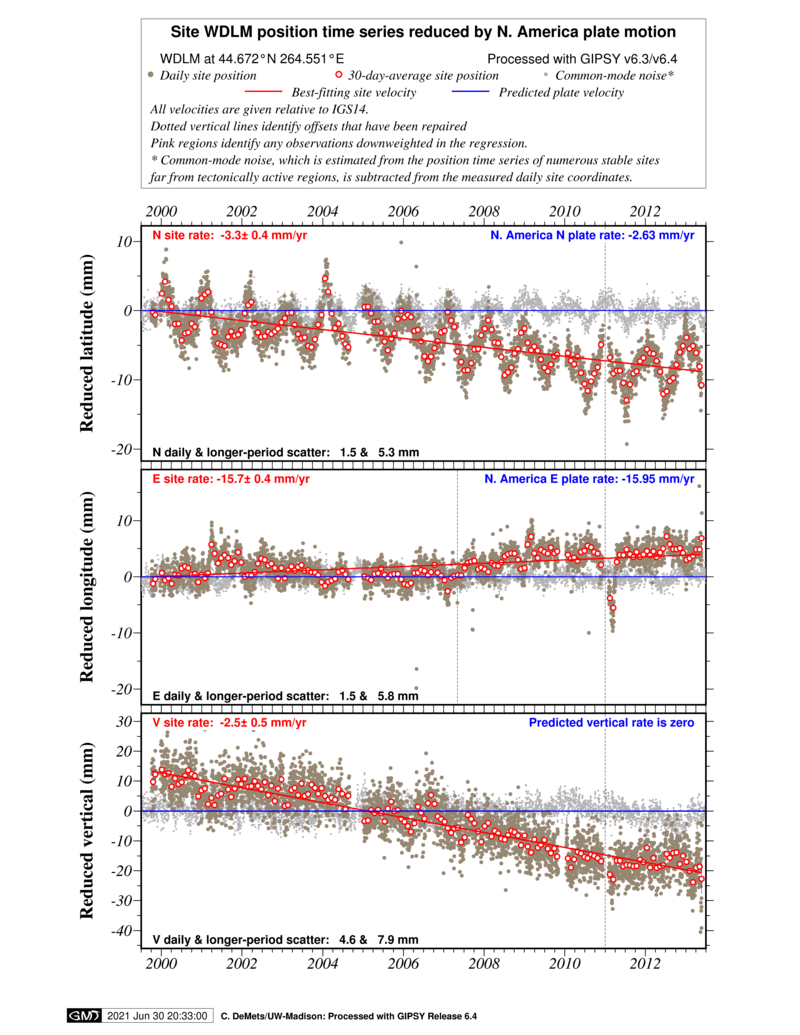
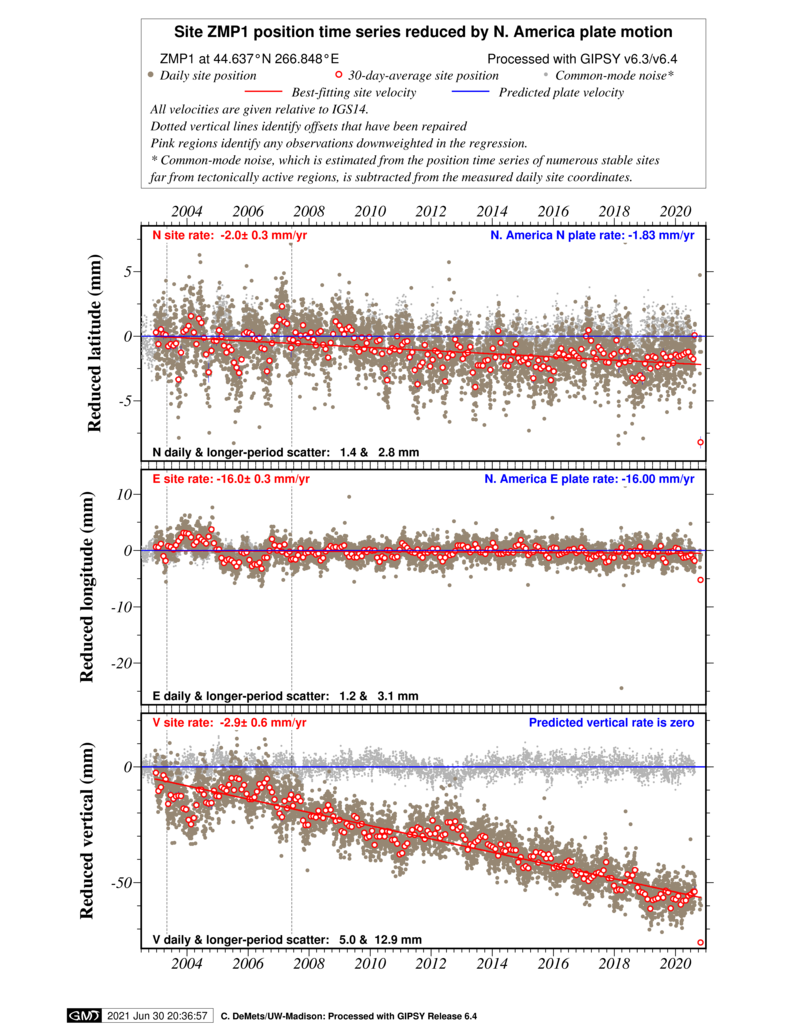
Table information: The table beneath the map provides clickable links to
the coordinate time series for all the continuous GPS stations in Iowa and nearby areas,
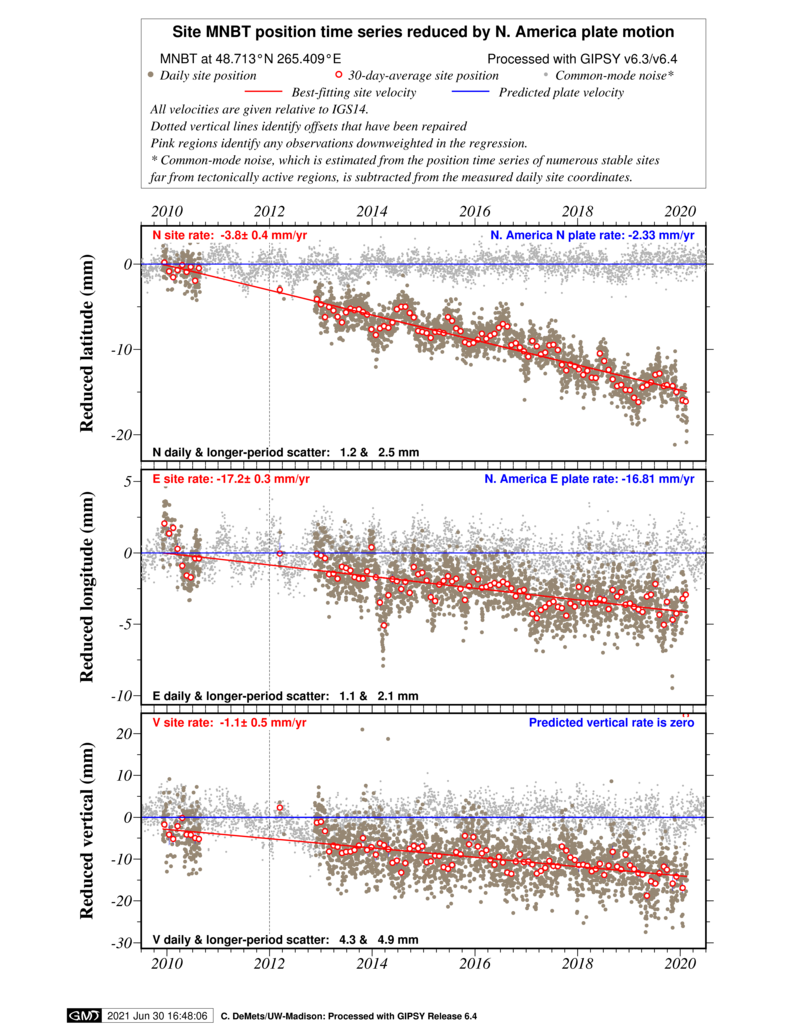
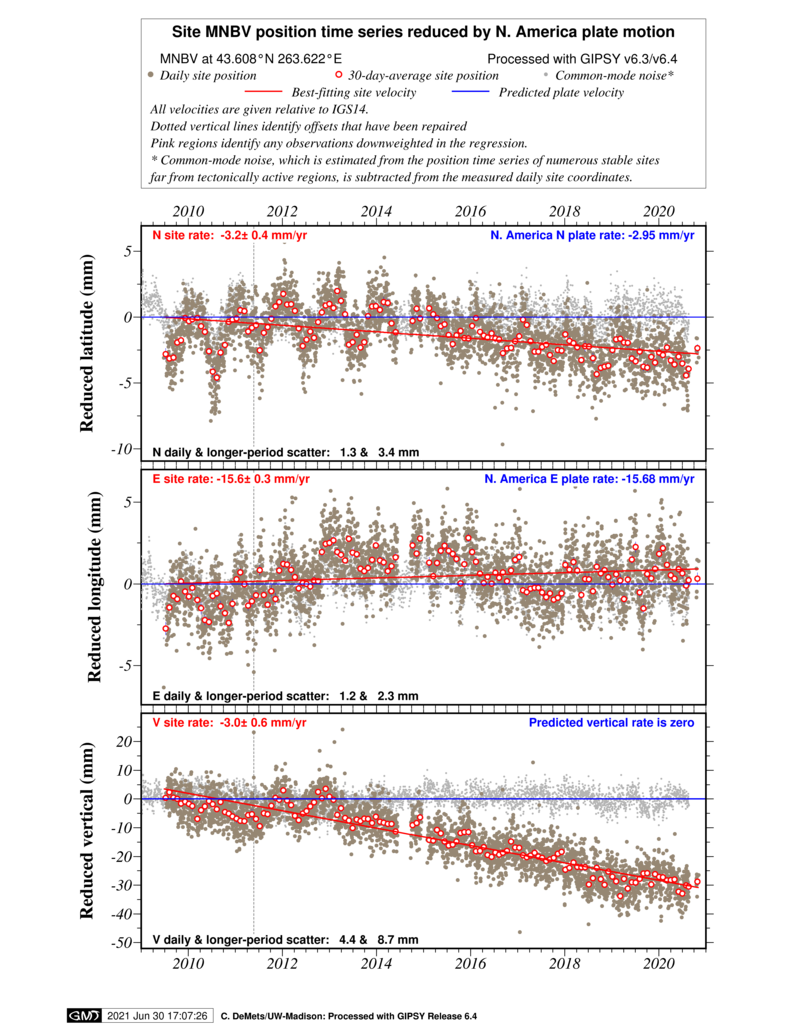
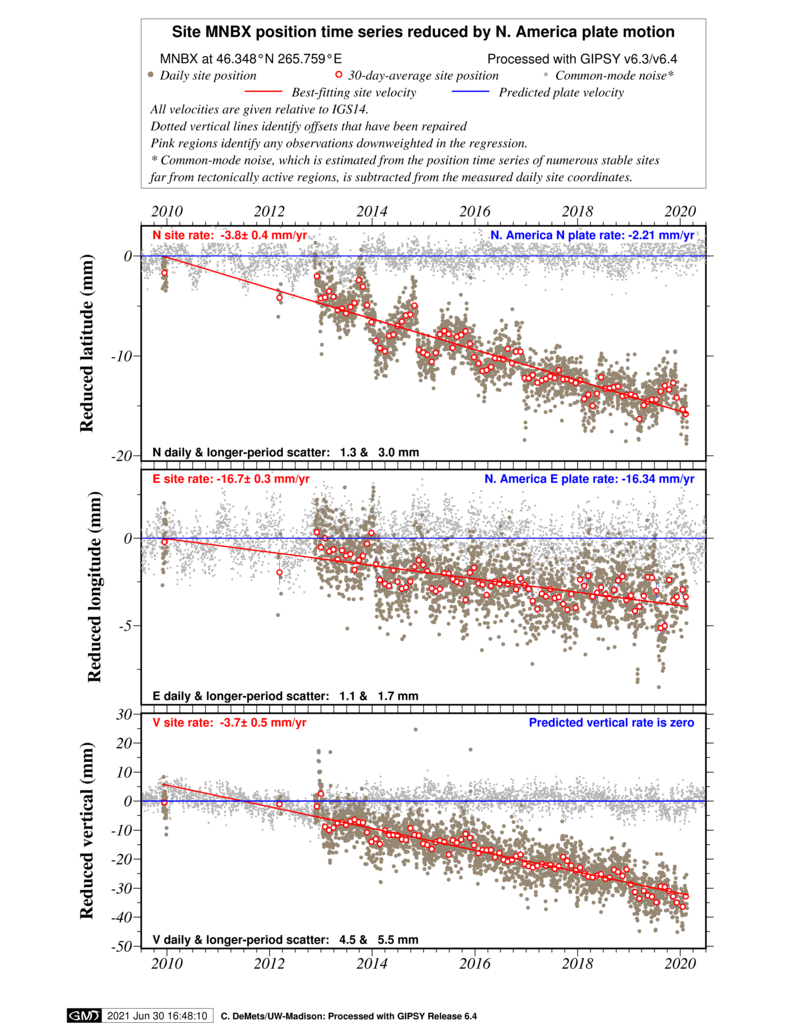
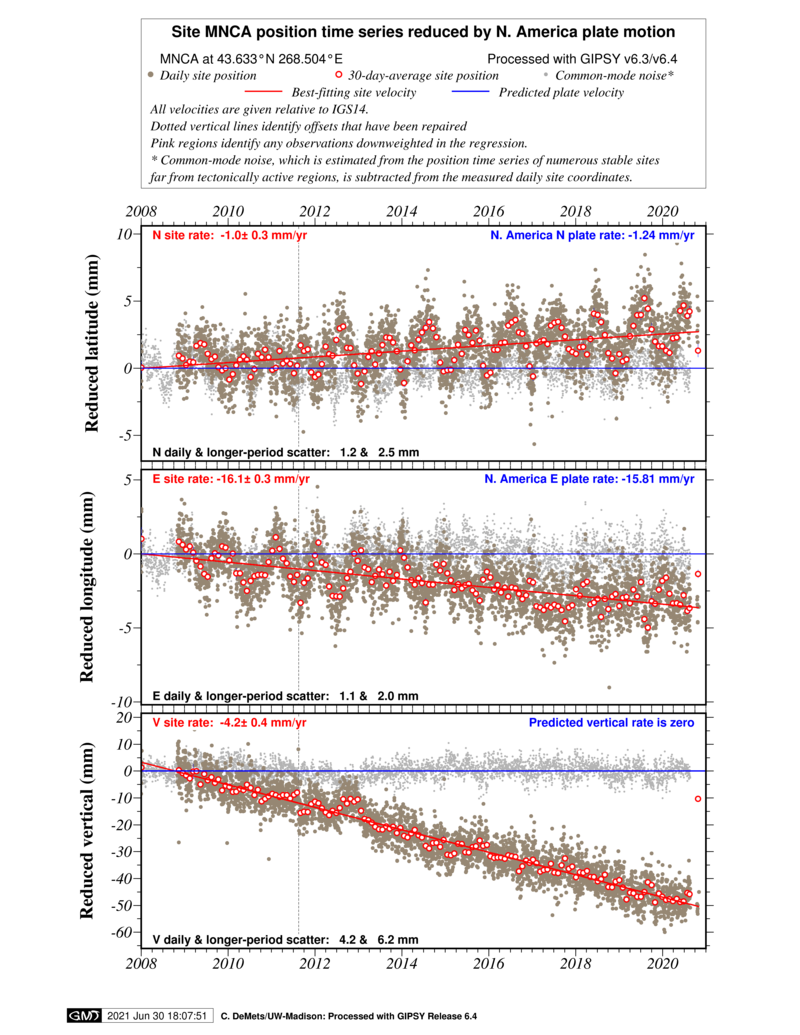
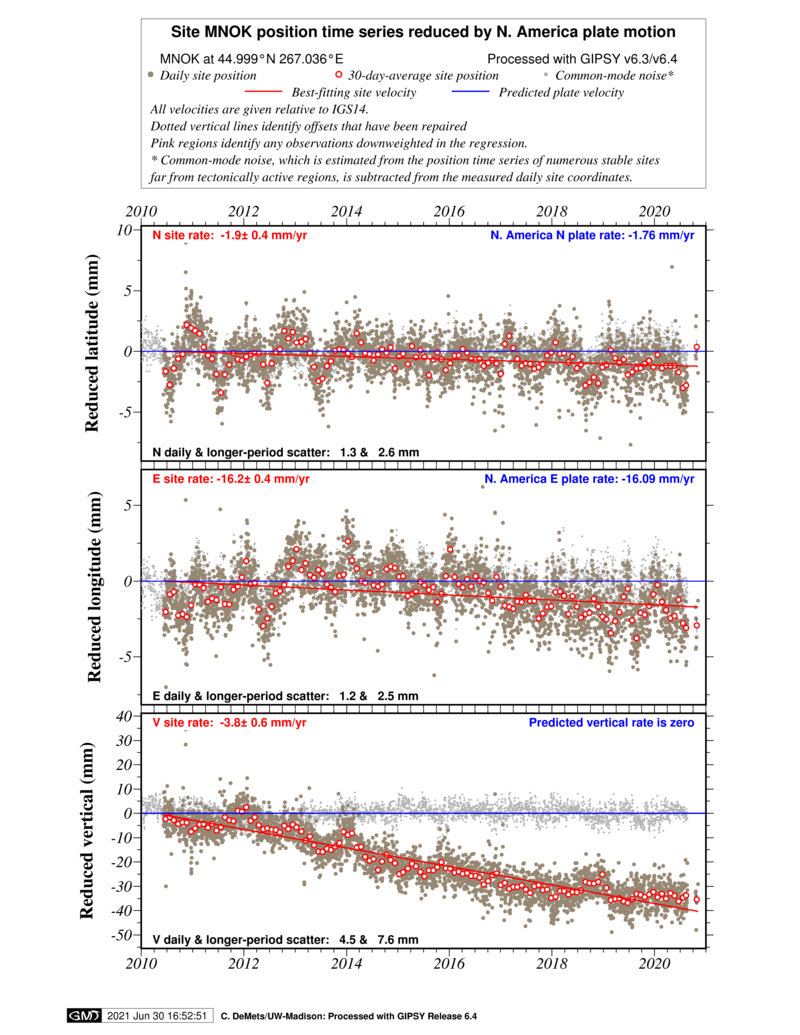
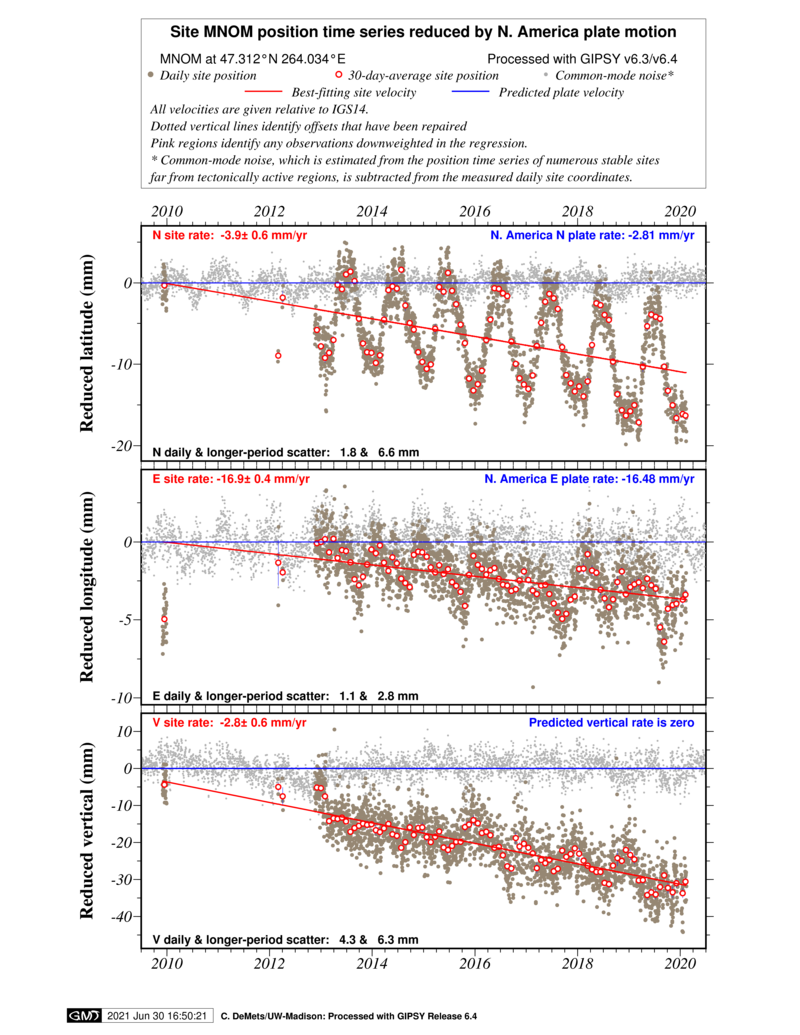
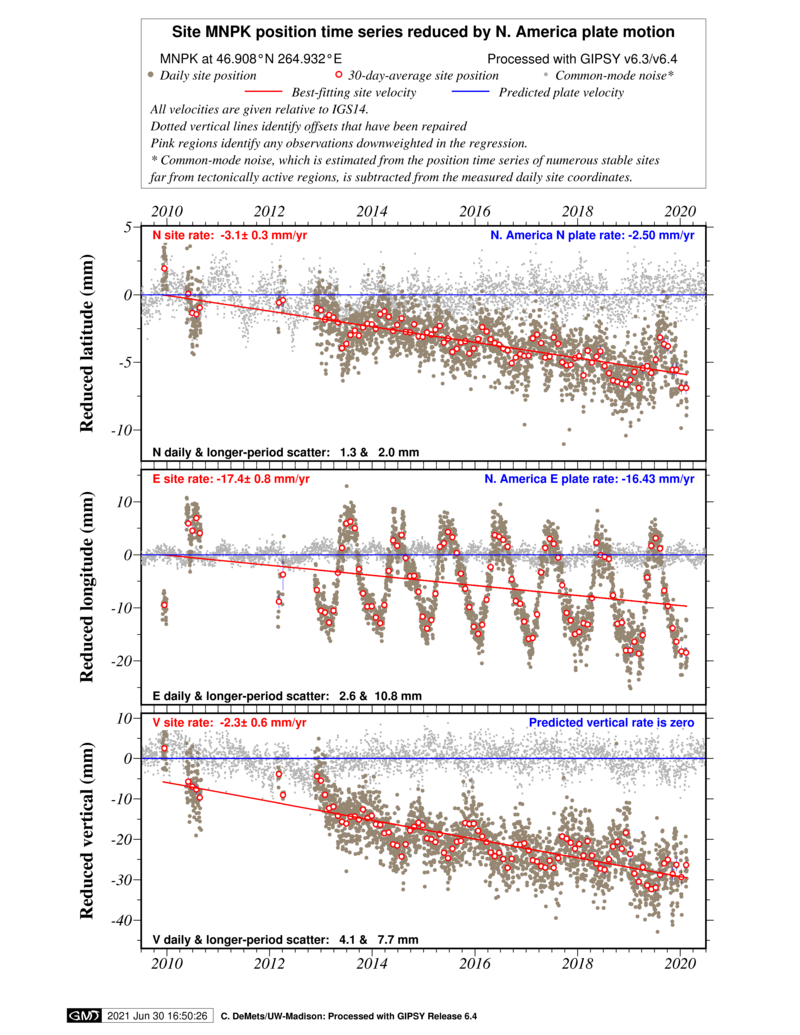
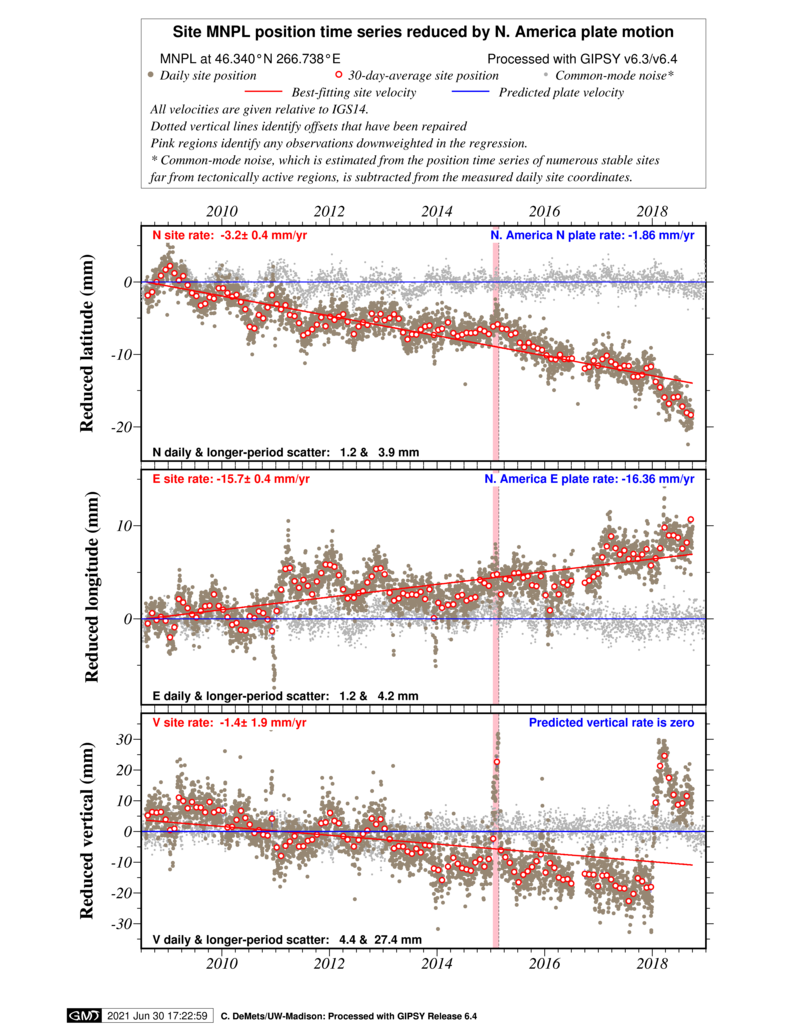
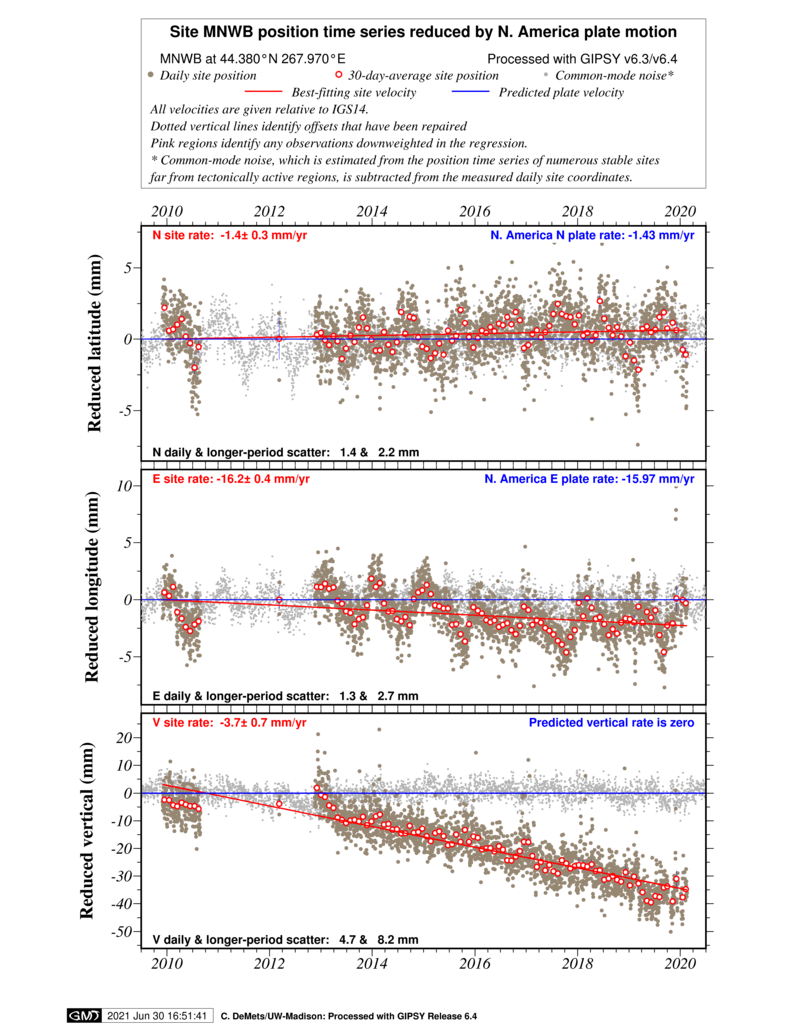
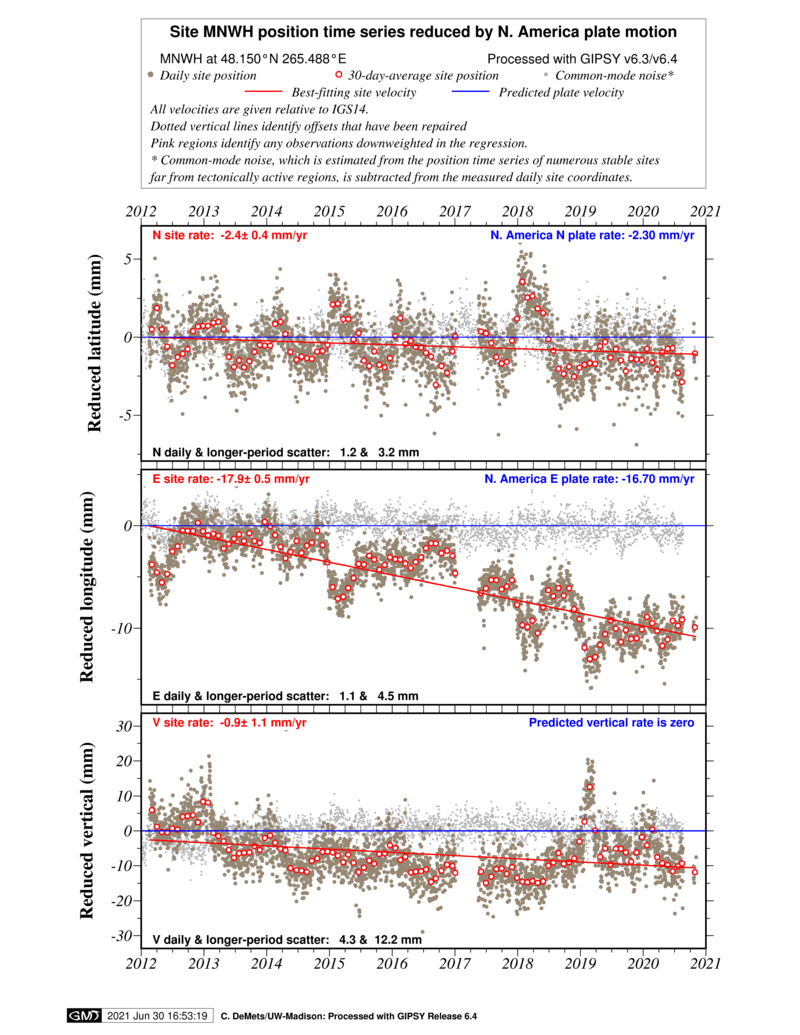
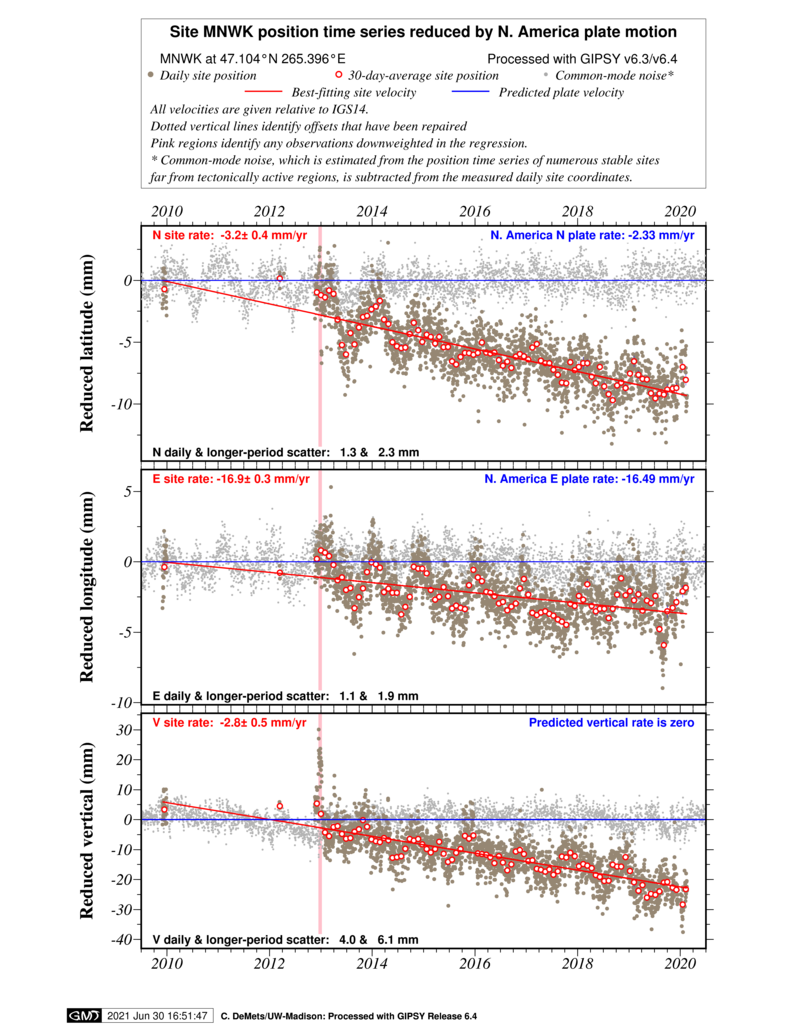
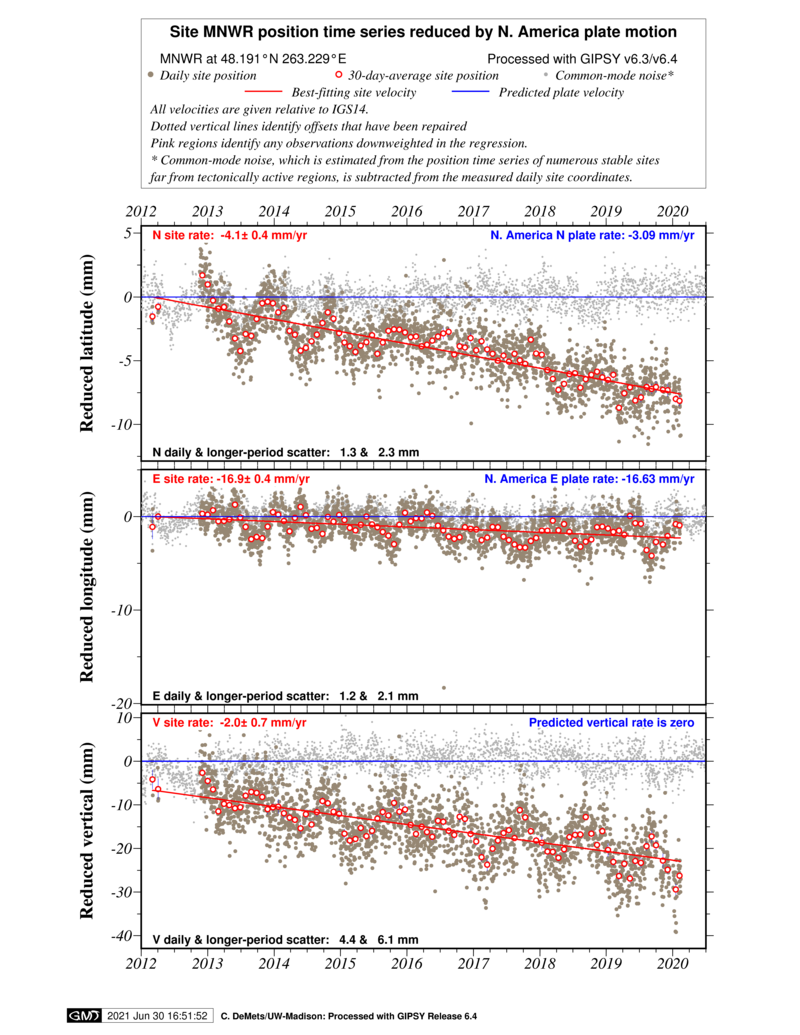
including all continuous GPS sites in Minnesota. Each graphic shows the sequence of daily station
latitudes, longitudes,
and elevations estimated from processing of daily GPS data at UW-Madison (information about
the processing is given on the home page of this web site). Red circles in the graphics
show the 24-hour coordinate estimate; blue circles show averages determined from 30 days of
daily estimates. Station motions are relative to the North America plate interior and thus
vary about the horizontal line (representing zero motion). Each graphic gives both the
best estimate of North America plate motion at the site location and the best-fitting slopes
for the site coordinate time series. "WN" indicates the amount of daily scatter in millimeters
of the site coordinates about the mean location.