
Cornelia Winguth, Department of Geology and Geophysics and
Department of Atmospheric and Oceanic Sciences, University of
Wisconsin
David M. Mickelson, Department of Geology and Geophysics, University
of Wisconsin
Patrick M. Colgan, Department of Geology, Northeastern University
Benjamin J. C. Laabs, Department of Geology and Geophysics, University
of Wisconsin
We use a time-dependent two-dimensional ice flow model to explore the development of the Green Bay Lobe, an outlet glacier of the southern Laurentide Ice Sheet, leading up to the time of maximum ice extent and during deglaciation (ca. 30 to 8 cal ka BP). We focus on conditions at the ice-bed interface in order to evaluate their possible impact on glacial landscape evolution. Air-temperatures for model input have been reconstructed using the GRIP δ18O record calibrated to speleothem records from Missouri that cover the time periods of ca. 65 to 30 cal ka BP and 13.25 to 12.4 cal ka BP. Model results indicate that the area uncovered by the Green Bay Lobe was characterized by permafrost until at least 14 cal ka BP. The extensive drumlin zones that formed behind the ice margins of the outermost Johnstown phase and the later Green Lake phase are associated with modeled ice margins that were stable for at least one thousand and probably several thousand years, high basal shear stresses (ca. 100 kPa) and permafrost depths of 80-200 m. During deglaciation, basal melt water and sliding became more important.
Figure 1: Maximum extent and several phases during deglaciation of the southern Laurentide Ice Sheet in the Green Bay Lobe area. Part of the flowline used here with numbered nodes and the occurrence of drumlin fields are also marked.
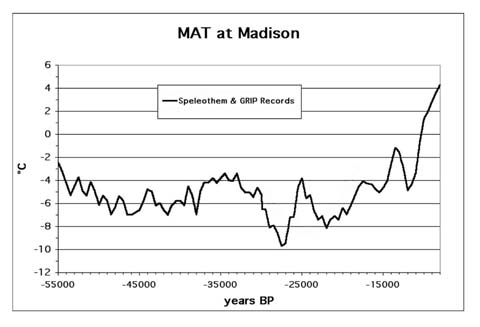
Figure 2: Mean annual temperature at Madison, generated by using a combination of d18O from a Missouri speleothem record (until 30 ka BP) and an adjusted GRIP d18O record (after 30 ka BP).
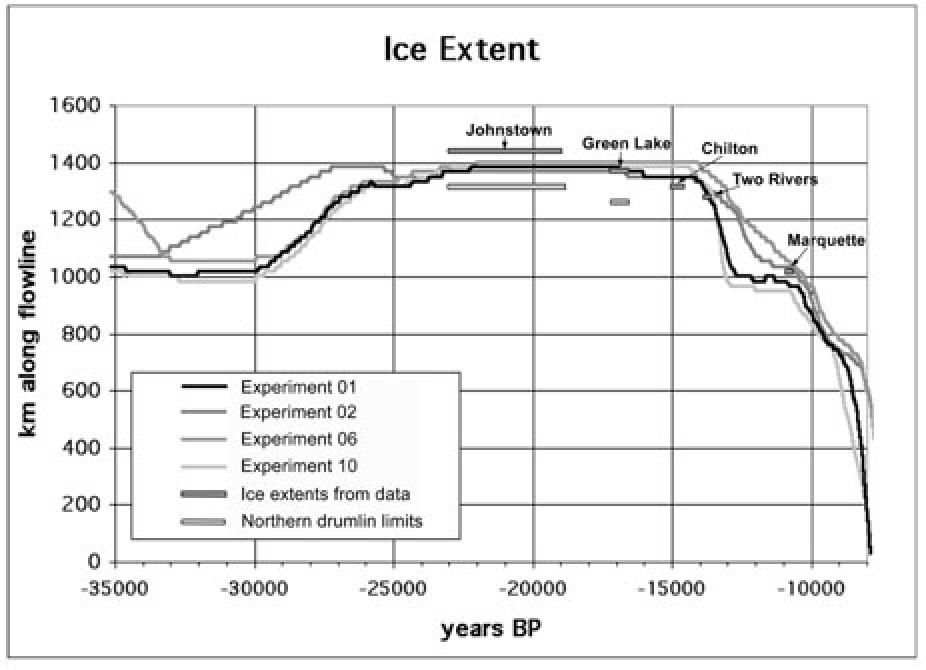
Figure 3: Modeled ice extents for Experiments 01, 02, 06, 10. Marked are also the ice extents known from field data as well as the northern margin of the drumlin fields associated with the Johnstown and the Green Lake phases.
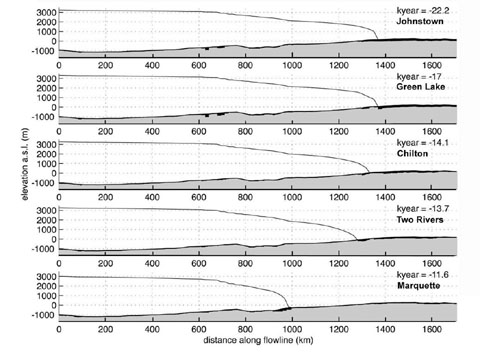
Figure 4: Ice thickness profiles and permafrost extent (black) during maximum extent and at different times during deglaciation for Experiment 01.
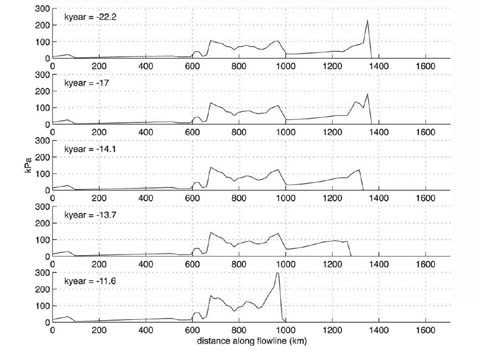
Figure 5: Basal shear stress distribution along flowline for Experiment 01 at different times during deglaciation.
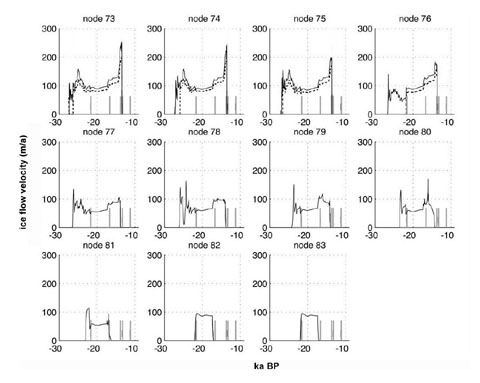
Figure 6: Ice velocities (total solid line, sliding dashed line) for Experiment 01 at nodes 73 to 83. Marked in grey are the times of the modeled ice extents corresponding to the Johnstown, Green Lake, Chilton and Two Rivers phases.
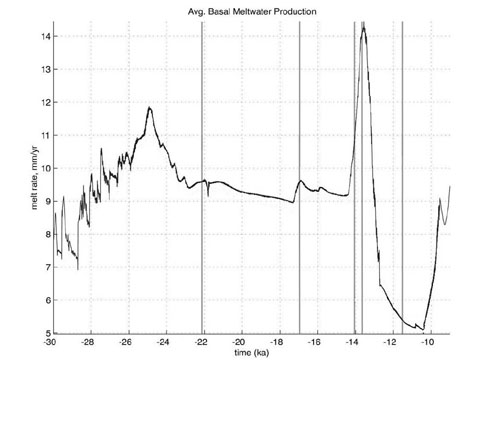
Figure 7: Average basal melt water production through time. Marked are the beginnings of the Johnstown, Green Lake, Chilton, Two Rivers and Marquette phases.