

Micro-Analysis of Sulfer-Isotope Ratios and Zonation by Laser Microprobe
Crowe, Douglas, E., Valley, John W., and Baker, Kevin L. (1990) Micro-analysis of sulfur-isotope ratios and zonation by laser microprobe. Geochimica et Cosmochimica Acta, v. 54, p. 2075-2092
Abstract
The University of Wisconsin laser microprobe/mass spectrometer system combines high spatial resolution with precise, accurate, and rapid analysis of sulfur-isotope ratios. Spot sizes of 100-200 m m are routine and much higher spatial resolution may be possible. Analytical precision ranges from 1s = ± 0.15‰ (pyrite, pyrrhotite, sphalerite) to 1s = ±0.43‰ (galena, chalcopyrite). Comparison of laser microprobe and conventional combustion analyses indicates that laser d 34S values are approximately equal to or lower than combustion values for these minerals, and an empirical correction of —0.1‰ (sphalerite) to + 1.4‰ (pyrrhotite) is required. Variations in d 18O of SO2, laser power density, and burn duration affect the magnitude of this correction; thus, consistent technique is critical.
Natural samples were analyzed by laser microprobe to evaluate the extent of sulfur-isotope ratio zonation. Coexisting sulfide mineral pairs from the Rua Cove Mine, Alaska, show that isotopic equilibrium exists in the stockwork feeder zone, while disequilibrium characterizes coexisting pairs from the overlying, more rapidly cooled massive sulfide blanket. Conventional sulfur isotope extraction data on these samples are not valid due to the fine-grained, intergrown nature of the sulfide phases, which precludes satisfactory mineral separation. Isotopically homogeneous sphalerite and pyrite crystals were found in samples from the amphibolite facies Balmat Mine, while isotopically heterogeneous pyrite crystals were found in a sample from the upper greenschist facies Sullivan Mine. Sulfur-isotope zonation up to 2.9‰ in 200 m m was found in banded sphalerite blacksmoker chimney material from the Bayda Mine (Oman). Retrograde sulfides from the Marcy Anorthosite Massif vary by 4.2‰ over <1 cm, and finely disseminated sulfides from an amphibolite-granulite facies transition zone sample, southern India, are in disequilibrium across the 25 cm facies transition. These results show that sulfur isotope homogeneity may be attained in the cores of annealed high-grade metamorphic minerals while lower temperature, retrograde, or hydrothermally deposited minerals are often isotopically zoned due to temporal variations in fluid chemistry and temperature.
|
Table 1. Sample descriptions and analytical precision of the laser microprobe for sulfur isotope analysis. |
|||
|
SAMPLE |
DESCRIPTION |
ANALYSIS |
d 34S ‰ CDT |
|
UW-Balmat FeS2 |
Euhedral crystals to 0.75 cm in sphalerite matrix. Balmat Mine, N.Y. Upper amphibolite facies sediment-hosted massive sulfide deposit. |
LZ-46-C LZ-46-D LZ-46-E LZ-48-A LZ-48-B LZ-48-C LZ-48-E average 1s EXT |
14.47 14.50 14.81 14.93 14.55 14.53 14.60 14.62 0.18 |
|
UW-Balmat ZnS |
Subhedral masses of crystals to 0.6 cm diameter, forms matrix for UW-Balmat pyrite. Same sample as UW-Balmat pyrite. |
LZ-24-A LZ-24-B LZ-24-C LZ-26-B average 1s EXT |
13.95 14.11 14.26 13.99 14.08 0.14 |
|
Anderson Fe1-xS |
Fine-grained massive sulfide. Anderson Mine, Ontario. Amphibolite facies volcano- genic massive sulfide deposit. |
LZ-68-D LZ-68-E LZ-68-F LZ-68-G Average 1s EXT |
0.05 -0.13 0.19 0.13 0.06 0.14 |
|
Esperanza CuFeS2 |
Fine-grained massive sulfide. Esperanza Mine, South Africa. Stratiform Cu deposit. |
LZ-70-A LZ-70-B LZ-70-C LZ-70-D average 1s EXT |
-0.94 -1.87 -1.76 -1.80 -1.59 0.44 |
|
Kenoyer PbS |
Single 5 cm crystal. Kenoyer Mine, Oklahoma. Mississippi Valley type deposit. |
LZ-34-C LZ-34-D LZ-34-E average 1s EXT |
-7.42 -7.84 -8.26 -7.84 0.42 |
| Figure 6. Backscattered electron image of a polished laser combustion pit in Esperanza chalcopyrite. Note radial and concentric fractures produced during combustion and concentric compositional variation. Traverse A-B is electron microprobe traverse shown in Fig. 7. Scale bar = 100 m m. | 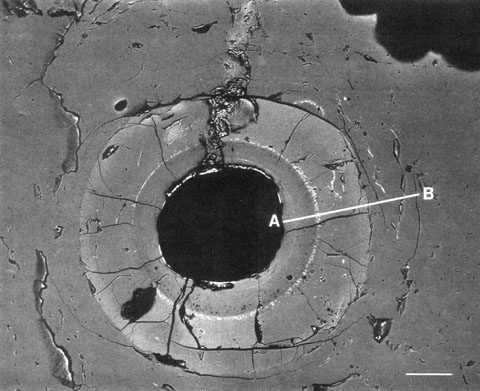 |
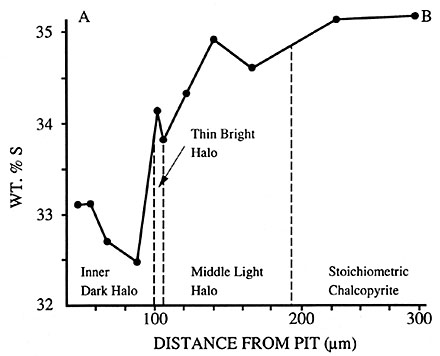 |
Figure 7. Electron microprobe data from traverse A-B shown in Fig. 6. Sulfur depletion is greatest in the innermost dark halo and decreases away from the laser combustion pit. The inner zone may be isotopically fractionated causing reproducible and systematic differences in d 34S between conventional and laser analysis. |