

Ion Microprobe Analysis of Oxygen, Carbon, and Hydrogen Isotope Ratios
Valley, J.W., Graham, Colin M., Harte, Ben, Eiler, John M., and Kinny, Peter D. (1998) Ion Microprobe Analysis of Oxygen, Carbon, and Hydrogen Isotope ratios. In: Applications of Microanalytical Techniques to Understanding Mineralizing Processes, McKibben, M.A., Shanks, W.C., III, and Ridley, W.I. (eds.). S.E.G. Review in Economic Geology, v. 7, p. 73-97
Introduction
Oxygen, carbon, and hydrogen are the most abundant elements in mineralizing fluids, and their isotope ratios provide a powerful tool for deciphering the complex histories of mineralizing systems. In particular, stable isotope ratios can be used to constrain theories of fluid sources, pathways, and fluxes, mechanisms of mineral reaction and exchange, and thermal evolution. This chapter will review studies of the stable isotopes of oxygen, carbon, and hydrogen with emphasis on recent work that has attained accuracy in the 1 per mil range for d13C (10‰ for dD) that is necessary for research on terrestrial samples.
The vast majority of all stable isotope ratio analyses have been made of 1 to 100 mg samples of whole-rock powder or mineral separate. Commonly, analyses have been made of splits, prepared from much larger samples with the implicit assumption that measured compositions are representative of the sample as a whole and thus that samples are homogeneous at the centimeter scale or larger. The need for microanalytical techniques to test this assumption and the untapped wealth of information recorded as mineral zonation has long been a recognized, but unattainable goal.
Recent technical advances permit analysis of far smaller samples with accuracy and precision sufficient for studies of natural materials having terrestrial isotope ratios. At present, the ion microprobe/secondary ion mass spectrometer (SIMS) provides the best spatial resolution, but at some cost in analytical precision relative to new laser-heating/gas-source mass spectrometer systems or long established conventional techniques that employ gas-source mass spectrometers. Table 1 summarizes the capabilities of various techniques that are available for analysis of stable isotope ratios. At present, no single technique is superior for all applications and the advantages of different techniques complement each other, as demonstrated by recent studies that have applied two or all three methods.
The accuracy of stable isotope analysis by ion microprobe has been dramatically improved, and the difficulty and expense of analysis reduced in the past few years since the first reliable sub-per mil-precision data were obtained. Compared to other stable isotope techniques, the analyzed volumes are so small (as little as 75 m m3 of material is consumed) that ion probe analysis is nearly nondestructive. Spatial resolution of 1 to 20 m m is possible, and the sample can be studied in thin section before and after analysis. These advantages are especially significant for studies of samples that are too small for measurement by other techniques; too precious for more destructive forms of analysis; isotopically zoned at the m m scale; or of uncertain homogeneity. In such studies, ion microprobe analysis is justified by the uniqueness of the data that can be answered.
We have divided this review into three parts. In the first section, details of the ion microprobe instrument are described along with procedures that have been successfully applied to stable isotope analysis. This information should be useful to researchers planning to make such measurements and to those wishing to evaluate published work. The second section reviews processes that can lead to fine-scale isotope zonation in nature and discusses the potential significance of microanalysis. In the last section, a variety of examples are reviewed that demonstrate the power of microanalysis for deciphering complex events and processes. In many cases, microanalytical data have led to re-evaluation and revision of conclusions that were based on analysis of larger isotopically-heterogeneous samples.
Table 1. Characteristics of Various Techniques for Light Stable Isotope Analysis
|
Technique |
Isotopes, Minerals |
Sample Prep. |
Typical Sample Size |
Spatial Resolution |
Precision (1 sd) |
Referrences |
|
CONVENTIONAL TECHNIQUES |
||||||
|
Ni reaction vessels Phosphoric acid Combustion Combustion Fusion |
O silicates, oxides O,C carbonates C graphite, diamonds S H solids |
Powder or chips Powder or chips Powder or chips Powder or chips Powder or chips |
10-20mg >10mg >1mg >1mg 50-100mg |
- - - - - |
0.2‰ A 0.03-0.1% B 0.03% 0.1‰ 1-2‰ |
1 2 3 4 5 |
|
LASER PROBE / MASS-SPECTROMETER |
||||||
|
Laser probe Laser probe Laser probe Laser probe Laser probe |
O silicates, oxides O silicates, oxides S O,C carbonates O phosphates |
Powder or chips In situ In situ, chips In situ Powder or chips |
³0.5 mg ³0.5 mg ³0.1 mg ³ 0.5 mg ³0.5 mg |
500 mm 500mm(5mm)C 200 mm 500 mm 500 mm |
0.07‰ 0.3-0.5‰ 0.2‰ D 0.1‰ |
6.7 6 8 9 10 |
|
ION MICROPROBE / SIMS |
||||||
|
Ion probe Ion probe Ion probe Ion probe Ion probe Ion probe |
O oxides (conductors) O silicates or conductors O carbonates S H C |
In situ In situ In situ In situ In situ In situ |
0.4 ng 5-10 ng 5-10 ng |
8 mm 20 mm 20 mm 20 mm 20-30 mm 3-30 mm |
0.5-1‰ 0.5-1‰ 0.5-1‰ 0.25-1‰ 10‰ 0.5-1‰ |
11 12 13 14 15 16 |
Footnotes: ASome labs analyze 2 mg and attain precision £ 0.1 per mil; BPrecision for C is typically better than for O; CIn situ pits are surrounded by 5mm haloes that prevent high analysis density, and causes fractionation with IR lasers. UV lasers may prevent such edge effects for improved spatial resolution and precision (Weichert and Hoefs, 1995); DPrecision and accuracy may be sample and procedure dependent.
REFERENCES: 1. Clayton and Mayeda, 1963; 2. McCrea, 1950; Sharma and Clayton, 1965; Rosenbaum and Sheppard, 1986; 3. Craig, 1953; Des Marais and Moore, 1984; 4. SO2: Rafter, 1957;Robinson and Kusakabe, 1975; SF6: Rees, 1978; 5. Bigeleisen, 1952; Godfrey, 1962; 6. Sharp, 1990; Elsenheimer, and Valley, 1992; 7. Valley et al. 1995; 8. Crowe et al., 1990; 9. ,Smalley et al., 1989; Sharp and Cerling, 1996; 10. Kohn et al., 1996; 11. Valley and Graham, 1991a; 12. Hervig, et al., 1992; Eiler et al., 1997a; 13. Valley et al., 1997b; 14. Deloule et al., 1986; Eldridge et al., 1988; Riciputi, 1996; 15. Deloule et al., 1991a,b; 16. Zinner et al., 1989; Harte and Otter, 1992; Eiler et al., 1997b.
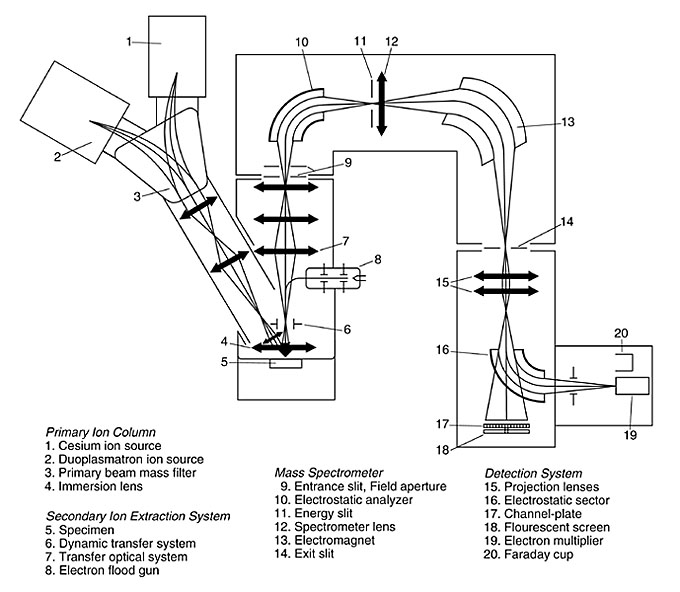 |
Figure 1. Schematic diagram of a CamecaTM ims 4f ion microprobe (modified from Cameca company literature). |
 |
|
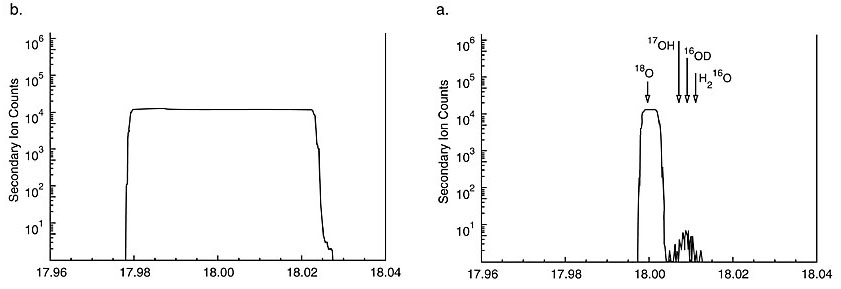
Figure 2. Mass scans of peaks
at 18amu. 2a. At low MRP = 300, a broad peak results. Hydrides are not
resolved and would contribute to the mass 18 signal without the energy
filtering used under these conditions. Note that count rate would be
severely decreased by energy filtering. 2b. Peaks at the high mass resolution
(MRP = 3,000) and at 0 energy offset; peaks for 18O and hydride
interferences are clearly resolved (Valley and Graham, 1991a).
|