
The theory of plate tectonics
Definition of the theory
Present day plates and their velocities
Evidence for the theory of plate tectonics
Types of plate boundaries
I. Definition and relevance
Plate tectonics - the theory that the earth's lithosphere is composed of a mosaic of rigid plates that are in relative motion.
Plate tectonics affects humans in several important ways.
What would Earth be like without plate tectonics? We'd have many fewer earthquakes and much less volcanism, fewer mountains, and probably no deep-sea trenches. Our weather would be more uniform due to the lack of significant topography and landscapes would be older due to a lack of tectonic renewal. In other words, the Earth would be a much different place. It is fair to say that our planet is unique (thus far) in several respects - it has an abundance of life, an abundance of water, and the surface is constantly renewed by plate tectonic processes.
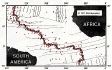
A view of earthquakes within the upper 40 miles of the earth's surface illustrates one line of evidence that the earth's lithosphere can be divided into a set of internally rigid plates.
Caption: Earthquakes with magnitudes greater
than 3.5 that ruptured the upper 60 kilometers of the earth's surface between
1/1987 and 1/1997. Each dot shows an earthquake. Continental
outlines and other geographic markers are omitted intentionally.
Earthquake - During an earthquake, the lithosphere breaks suddenly along a fault. Slip of a few millimeters to tens of meters typically occurs along the fault during an earthquake. Repeated earthquakes can thus cause significant movement of the crust on one side of a fault relative to the crust on the other side.
As shown in the figure, most (~90%) earthquakes are concentrated in remarkably narrow belts that connect to form a spider web of fault zones that divide the lithosphere into nearly aseismic regions called plates. A key postulate of the theory of plate tectonics is that plates are internally rigid, meaning that over geologic time, they retain their shape because they do not deform. The concentration of earthquakes along narrow fault zones between the plates tells us that plates move relative to each other and that the motion is often focused along narrow boundaries between them.
Plate boundaries are defined as the fault zones that separate the rigid interiors of plates. Many plate boundaries are narrow, particularly seafloor spreading centers and transform faults (discussed farther below). However, the following figure clearly shows that earthquakes in continents are often distributed over a broader region than in oceanic crust. This occurs because the strength of continental lithosphere as a function of depth differs significantly from that of oceanic lithosphere, which tends to be strong and homogeneous from top to bottom. Plate boundaries within continents are typically wide. For example, the collision zone between the Indian and Eurasian plates (30-45N, 60-100E) extends some 1500 km in areas. Even though continental earthquakes are often widely distributed, large areas are aseismic and define rigid plate interiors.
Caption: Earthquakes from 1/1987-1/1997 with magnitudes greater than 3.5 and depths shallower than 60 km. Coastlines are shown for reference.
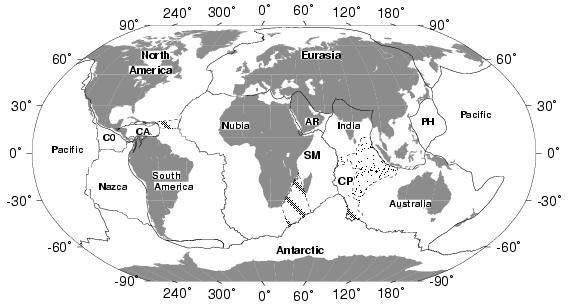
The present geometry of plates as defined by earthquakes and other types of geologic observations such as traditional structural geology and detailed images of seafloor bathymetry (i.e. depths beneath the ocean surface) is shown below.
Caption: Global plate geometry (also see figure from previous lecture)
Unlike the earlier, but now disproven hypothesis of continental drift, which postulated that continents plow through oceanic crust as they migrate across the earth's surface, plate tectonic theory postulates that continental and oceanic lithosphere both move as rigid or nearly rigid caps on top of the circulating (convecting) mantle. A single tectonic plate can consist of only oceanic lithosphere or both oceanic and continental lithosphere, depending on where the plate's boundaries are located. Although the boundaries between plates sometimes coincide with the edges of continents, this is not always the case (see the figures shown above). For example, the North American, Eurasian, South American, African, Australian, Indian, and Antarctic plates all have substantial areas of both oceanic and continental lithosphere.
Plate velocities are known
precisely (to within a few percent) and are shown to the right as the
rate and direction of motion across various plate boundaries. The velocities
(shown in inches per year) range from as slow as one millimeter per year
to as fast as 200 millimeters per years (equivalent to 8 inches per year!).
Plate velocities can be measured using two independent techniques. Plate
movements over periods of months to decades can be measured directly using
extremely precise positioning equipment. Plate movements over geologic time
spans (millions of years) can be estimated from seafloor spreading rates
and the azimuths of faults in the ocean basins that are known to parallel
the local direction of plate slip. Velocities determined using these independent
techniques typically agree to within several per cent.
Although velocities of 1-200 mm/yr seem
very slow, a plate that moves 100 millimeters per year will move 1000 kilometers
(600 miles) over ten million years. This is enough to open a new ocean basin
or alternatively, to move crust on one side of the San Andreas fault by a
distance equal to the length of the state of California relative to crust
on the other side of the fault. Over the course of one century, slip of
merely 35 millimeters per year across a fault such as the San Andreas fault
results in cumulative slip of 3.5 meters (more than 10 feet), equivalent
to the slip that occurs during a magnitude 7-8 earthquake.
An enormous and diverse body of evidence supports the theory of plate tectonics. A few lines of evidence are listed below.
You are not responsible for understanding all of these lines of evidence
The types of fault zones (i.e. plate boundaries)
that separate two plates depend on the nature of motion between those plates.
This motion consists of three end-members:
Divergent plate boundaries are most commonly seafloor spreading centers, where new seafloor is created continually as two plates diverge from each other.
Seafloor spreading centers have the following interesting characteristics:
- They are the source of most of the earth's volcanism.
- They form elongated ridges that stand high above the surrounding seafloor. These are referred to as "mid-ocean ridges".
- A deep valley (the axial valley) typically bisects the ridge - this valley is the locus of new lava flows and seafloor accretion.
- Numerous vents in the axial valley spew hot seawater that has migrated down through cracks and contacted the hot, recently solidified crust in the upper few km of the subsurface. These vents are called either "black smokers" or "white smokers" to designate the color of the water that is discharged. The hydrothermal water is super-charged with sulfur and other elements that it dissolved from the hot rocks beneath. Upon contacting the colder seawater above, the elements being carried in solution precipitate and form rich ore deposits in the vicinity of the seafloor spreading center.
- The chemical-laden water near the vents provides food for peculiar biological communities that have evolved in the dark and receive all of their sustenance from chemicals.
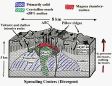
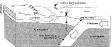
Image 1: Cartoon cross-section of seafloor spreading center. Magma that extrudes to the ASC (the axial spreading center) taps a molten "lens" of magma roughly 1-2 km beneath the ASC. This lens is fed by partial melt from beneath. CLICK ON THIS IMAGE FOR A CLOSER VIEW.
Why is new seafloor created along seafloor spreading centers? Mantle beneath the ASC experiences increasingly lower pressure as the two plates on either side of the spreading axis stretch and thin the intervening lithosphere. Since the melting point of the mantle rocks beneath the ASC decreases as the pressure on it decreases, minerals in the upper mantle with the lowest melting points begin to melt. This melt squeezes through the cracks between the still-solid minerals and migrates upwards to a magma chamber. The magma in this chamber then feeds to the surface, where it contacts seawater, solidifies, and forms new seafloor (basalt). Some of the magma solidifies beneath the surface and forms gabbro. Recent experiments in the eastern Pacific Ocean indicate that partial melting of the upper mantle occurs at depths and horizontal distances of 100-200 km from the axis of seafloor spreading. The total fraction of the mantle that is melted in this broad region is only 1-2% of its volume and it is assumed that this melt migrates gradually toward the spreading axis, where it constructs new oceanic crust. Our understanding of the process of seafloor generation is still incomplete and subject to revision.
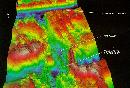
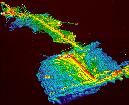
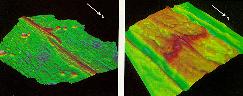
Geophysical studies of seafloor spreading centers using ship-towed high-resolution sonar systems have greatly improved our knowledge of these features. The four images below are color perspective images of seafloor spreading centers in the Atlantic and Pacific Ocean basins, provided courtesy of Professor Ken Macdonald, U.C.-Santa Barbara.
(Please CLICK on each image below for a larger, more detailed view and description of the image and its interpretation).
Map view of seafloor spreading center (Juan de Fuca rise intersection with the Blanco fracture zone) - 100 meter resolution. The locus of seafloor spreading is in the deep blue region (the axial valley) that is flanked by orange, topographically high flanks.
Click on the image to enlarge it.
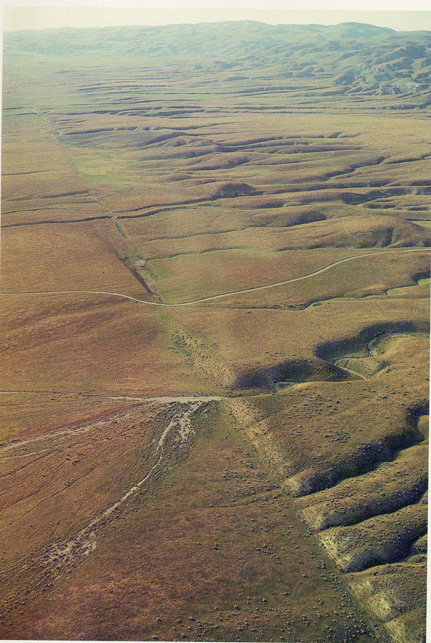
Caption: The San Andreas fault in central California (left) is an example of a transcurrent plate boundary within a continent. Contrary to popular belief, the part of California that lies west of the San Andreas isn't going to fall into the ocean during a future earthquake.Western California will instead migrate slowly to the northwest along the San Andreas fault. Click on the image to enlarge it.
Transcurrent plate boundaries are also found in the ocean basins, most commonly as transform faults. Transform faults are typically remarkably straight features that transfer motion between the individual segments of seafloor spreading centers that they offset. Slip along transform faults is driven by opening along the spreading segments located at either end of the transform fault, hence such faults are seismically active only between the spreading segments. Parts of an actively slipping transform that move beyond the spreading segments on either end of the transform become seismically inactive and are preserved as fracture zones. Earthquakes bear this out (see Image 1 beneath)
Click on the image below for a detailed map of a typical transform fault.
Seafloor bathymetry for the Ascension transform fault along the equatorial Mid-Atlantic Ridge. Transcurrent motion occurs along the narrow, straight fault shown by the deeper blue areas of the image. Image provided courtesy of the Lamont-Doherty Earth Observatory "RIDGE Multi-Beam Synthesis Project".
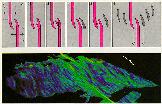
Line drawing of seafloor "fabric" in the vicinity of two spreading segments that are offset by an oceanic transform fault along the northern East Pacific Rise (between the Pacific and Cocos plates). Seafloor north of the transform fault moves to the west-southwest and seafloor south of the transform fault moves to the east-northeast. The sense of slip along the fault is thus left-lateral, meaning that seafloor on one side of the fault moves to the left with respect to an observer positioned across the fault. Click on the image to enlarge it.
The red dotsin the figure to the left show the locations of earthquakes in the equatorial Atlantic ocean. Dashed lines show the well-known locations of oceanic fractures, which are long faults that continue from transform faults on either side of a seafloor spreading center. Note that only the parts of the fracture zones located between two seafloor spreading segments are seismically active. The transform fault thus accommodates displacement between the plates, i.e. it is a plate boundary. The fracture zone does not, which is not surprising because fracture zones east of the MidAtlantic Ridge are located within the African plate and fracture zones west of the MAR are located within the South American plate. Click on the image to enlarge it.
- Convergent - Motion of two plates toward each other. Convergence can be accommodated as follows:
- Subduction of one plate beneath the other into the mantle, creating a subduction zone.
- Overriding of one plate on top of the other or crumpling of one or both plates, resulting in a mountainous region such as the Himalayan mountain belt.
- Lateral escape - Crust caught in a zone of collision between two plates often escapes by moving sideways (laterally) out of the collision zone.
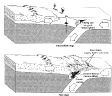
Conceptual diagrams of a subduction zone. Click on the images to enlarge them.
The diagrams above illustrate two important concepts associated with subduction. First, subduction of a plate into the mantle frequently gives rise to active volcanism within the overlying plate (for reasons detailed below). Second, mountain building is frequently (though not always) associated with subduction, as is accretion and uplift of oceanic marine sediments along the edge of a continent.
Since we cannot get into the mantle to observe the presence of a subducting oceanic plate, why are we so certain that subduction occurs? Two types of evidence tell us that subduction zones mark places where a plate is subducting into the mantle. First, the depth-distribution of earthquakes across a subduction zone clearly defines a slab that plunges at an angle into the mantle. The figure below illustrates this for the Tonga-Kermadec subduction zone in the southwestern Pacific. The inclined zone of earthquakes that defines the subducting plate is called the Wadati-Benioff zone.
Earthquakes that define the Wadati-Benioff zone record deformation of the downgoing or subducting slab in response to its internal stresses from bending, heating, and friction between itself and the adjacent mantle or crust. Seismic studies of large earthquakes in the shallow parts of subduction zones show that the slabs are thrusting downward into the mantle.
The second type of evidence that a plate is penetrating into the mantle is the geographic coincidence of volcanic arcs and subduction zones. For example, the figure below shows active volcanos in the vicinity of Japan in relation to the earthquakes that define the Pacific and Phillipine plates that are subducting beneath Japan. The volcanic "arc" clearly follows the subduction zone, but is located significantly onshore from the trench. In fact, the volcanos are located primarily above the "line" where the subducting plates reach depths of 100 km.
Earthquake locations (blue dots) and volcano locations (red triangles) in the vicinity of Japan. Click image to enlarge
Geochemical analyses of magma erupted from volcanos located above subducting plates indicate that the magma comes from at least two sources. When young and thus hot seafloor is subducted, at least part of the arc magmas comes from melting of the subducting plate. More frequently, arc magmas appear to derive from the wedge of hot mantle that lies above the subducting plate and beneath the base of the overlying continent. To cause melting of the mantle in these regions, something has to have changed in the mantle beneath the continent.
Melting of the mantle occurs because between 80-150 km depth, the temperature of the subducting slab gets high enough to cause the minerals in the subducting slab to dehydrate or lose their water molecules. The water that is shed by the subducting slab rises into the overlying mantle material and changes both its chemical composition and melting point. Adding water to dry mantle material causes a series of chemical reactions that alter the minerals in the mantle wedge. If enough water is added, the melting point of the mantle wedge is lowered significantly, thereby enabling the mantle above the subducting slab to melt (partially) and to ascend to the base of the overlying continent. Some of the melted material works it way to the surface, where a series of volcanos forms, and some of the material ponds and solidifies into batholiths, which are eventually exposed (via erosion) at the surface. The Sierra Nevada mountains in eastern California are an example of a batholith that formed within the lower reaches of a continent above a subducting plate.
Additional compelling evidence that the subducting slab penetrates to depth comes from analyses of element isotopes in gases and magma emitted from arc volcanos. Beryllium 10, an isotope of beryllium that has only ONE source, the atmosphere, is found in arc volcanics at concentrations far higher than expected for normal continental or oceanic volcanic rocks. Moreover, the concentration of Be10 in arc volcanics correlates strongly with the concentration found in the sediments that are being subducted immediately offshore from those volcanos. This indicates that ocean sediments that have accummulated Be10 from the atmosphere have subsequently subducted and have contributed to the composition of the magma that eventually extrudes from arc volcanos.
